System Stats & Management
Overview
- DietPi-Dashboard - Official lightweight standalone DietPi web interface
- DietPi-CloudShell - Lightweight system stats for your LCD display or monitor
- Linux Dash - Web interface system stats
- phpSysInfo - Web interface system stats
- RPi-Monitor - Web interface system stats
- Netdata - Web interface system stats
- Webmin - Remote system management with web interface
- K3s - Lightweight Kubernetes
- MicroK8s - Low-ops, minimal production Kubernetes
- Prometheus Node Exporter - Prometheus exporter for hardware and OS metrics
- Homer - A modern homepage for your services
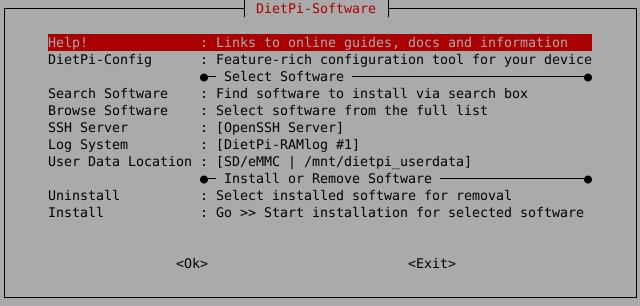
How do I run DietPi-Software and install optimised software items?
To install any of the DietPi optimised software items listed below run from the command line:
dietpi-software
Choose Browse Software and select one or more items. Finally select Install.
DietPi will do all the necessary steps to install and start these software items.
To see all the DietPi configurations options, review the DietPi Tools section.
Return to the Optimised Software list
DietPi-Dashboard
DietPi-Dashboard is a very lightweight and standalone web interface for monitoring and managing your DietPi system with your favourite web browser. It is written in Rust. An overview of its features is given by our article here.
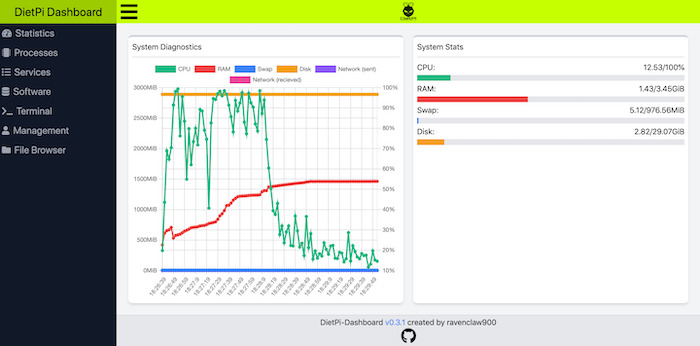
DietPi-Dashboard is still in Beta!
We hence do not recommend to actively use it on sensitive production systems yet.
DietPi-Dashboard is accessible by default at TCP port 5252:
- URL:
http://<your.IP>:5252 - Password:
<your software password>(default:dietpi)
The DietPi-Dashboard executable and its configuration file can be found at:
/opt/dietpi-dashboard
The configuration file is located at:
/opt/dietpi-dashboard/config.toml
When doing changes, you need to restart the service afterwards:
systemctl restart dietpi-dashboard
Password protection is enabled by default from DietPi v7.9 on. If you installed it before, you’ll need to enable it via configuration file. For this, create a SHA512 hash of the PASSWORD you want to use for logging into the web interface, and a random 64-character secret which is used to generate a token to transfer and store securely in your browser. Apply those to the configuration file and restart the service for the changes to take effect:
hash=$(echo -n 'PASSWORD' | sha512sum | mawk '{print $1}')
secret=$(openssl rand -hex 32)
G_CONFIG_INJECT 'pass[[:blank:]]' 'pass = true' /opt/dietpi-dashboard/config.toml
GCI_PASSWORD=1 G_CONFIG_INJECT 'hash[[:blank:]]' "hash = \"$hash\"" /opt/dietpi-dashboard/config.toml
GCI_PASSWORD=1 G_CONFIG_INJECT 'secret[[:blank:]]' "secret = \"$secret\"" /opt/dietpi-dashboard/config.toml
unset -v hash secret
systemctl restart dietpi-dashboard
To change the password, just replace the hash in the config file and restart the service.
If you want to force a logout of all browsers without changing the password, you can instead change the secret. Generate an apply a new secret to the configuration file and restart the service. Every client and browser will then need to login again to continue using the DietPi-Dashboard, as the stored token that is based on password and secret has been invalidated.
From DietPi v8.0 on, you can install DietPi-Dashboard as backend only node, with does not include an own web interface. Such backend only nodes can then be accessed from another full DietPi-Dashboard frontend/web interface. Additional nodes would need to be added manually into configuration file located at:
/opt/dietpi-dashboard/config.toml
When doing changes, you need to restart the service afterwards:
systemctl restart dietpi-dashboard
Full DietPi-Dashboard nodes with frontend included can currently not be accessed from other frontends.
DietPi-Dashboard by default is started as systemd service and can hence be controlled with the following commands:
systemctl status dietpi-dashboard
systemctl stop dietpi-dashboard
systemctl start dietpi-dashboard
systemctl restart dietpi-dashboard
Service logs can be reviewed with the following command:
journalctl -u dietpi-dashboard
You can easily update DietPi-Dashboard by reinstalling it and restarting the service for the change to take effect:
dietpi-software reinstall 200
systemctl restart dietpi-dashboard
Source code: ravenclaw900/DietPi-Dashboard
License: GPLv3
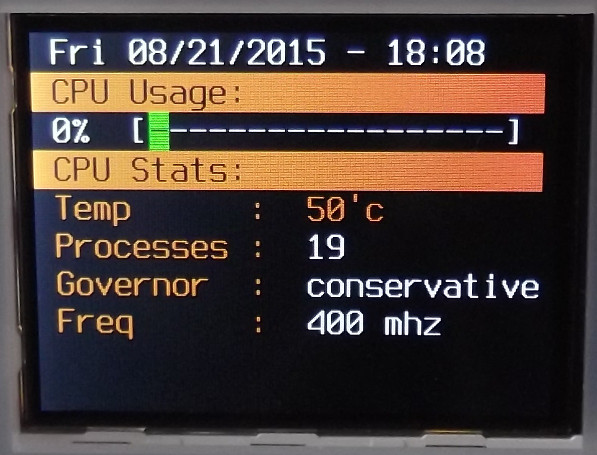
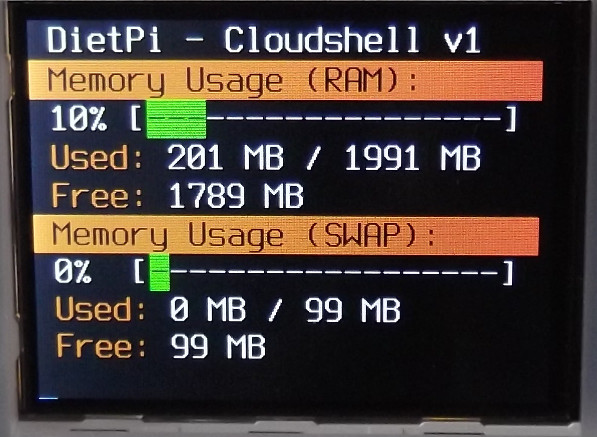
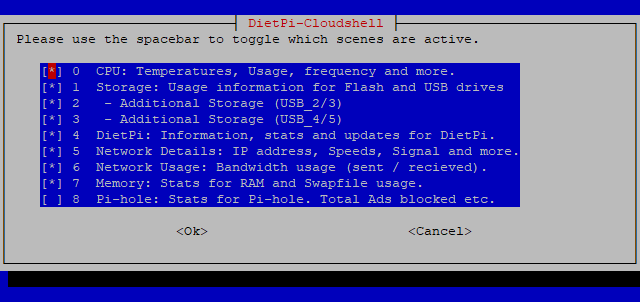
DietPi-CloudShell
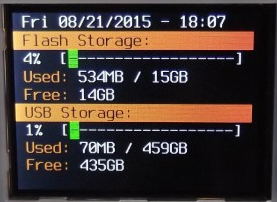
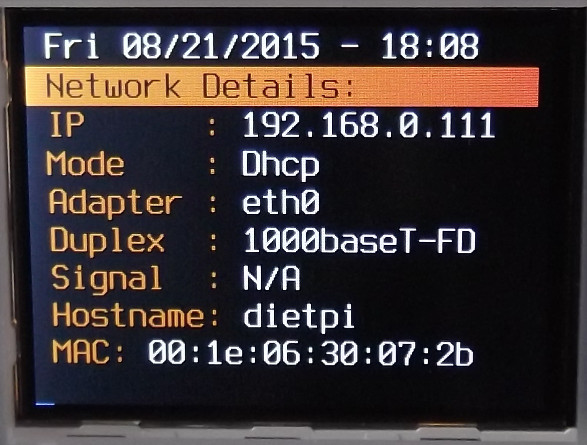
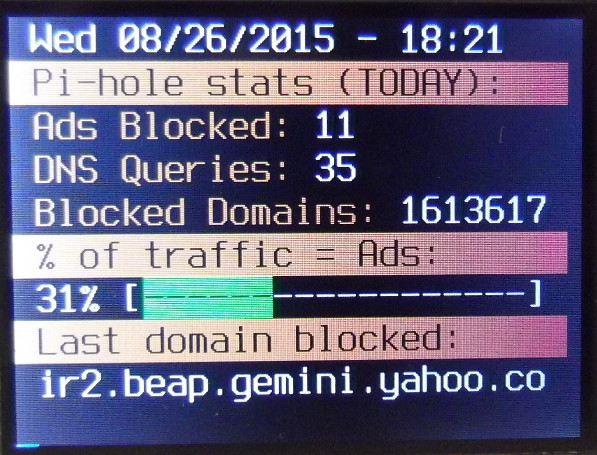
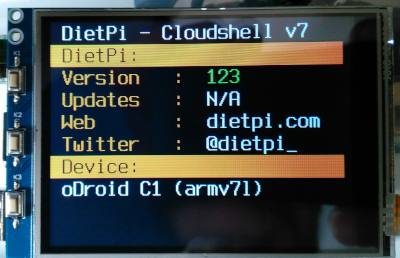
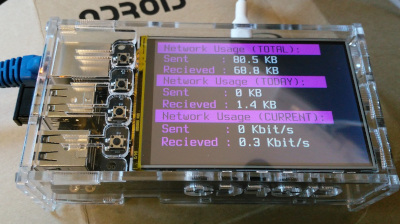
DietPi-CloudShell turns your console or LCD screen into a lightweight system stats display.
Sample screenshots
The following screenshots shall give an overview over the displaying features of DietPi-CloudShell.
YouTube video tutorial: DietPi CloudShell (RPi / Odroid XU4)
Configuration
Launch the DietPi-CloudShell control panel:
dietpi-cloudshell
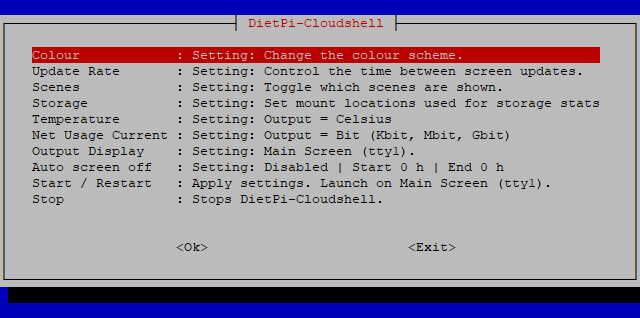
DietPi-CloudShell offers scenes with predefined display outputs resp. layouts.
Scenes are configured in the Scenes dialog within dietpi-cloudshell.
This feature will allow you to automatically power down the screen and disable DietPi-CloudShell processing during a specific time.
Please note this feature requires DietPi-CloudShell to be launched with dietpi-autostart, or run dietpi-cloudshell from the main screen (tty1).
If you make changes to DietPi-CloudShell over SSH, once saved, please reboot the system to ensure this feature becomes activated.
Power saving: Auto screen off
Touchscreen support
See https://www.waveshare.com/3.2inch-rpi-lcd-b.htm.
This is available for all Raspberry Pi and Odroid versions. DietPi will automatically configure your system for the device.
Simply run dietpi-config, select Display Options, then select waveshare32.
After a reboot, your Waveshare32 will become active.
See https://www.hardkernel.com/shop/c1-3-2inch-tfttouchscreen-shield/.
This is available for all Odroid versions. DietPi will automatically configure your system for the device.
Simply run dietpi-config, select Display Options, then select odroid-lcd35.
After a reboot, your Odroid 3.5 LCD will become active.
The display feature of DietPi-CloudShell works generally with any LCD display or monitor with a resolution of at least 320x240 pixels.
Linux Dash
Linux Dash allows you to monitor your system stats from a web page.
- Also Installs: LASP webserver stack
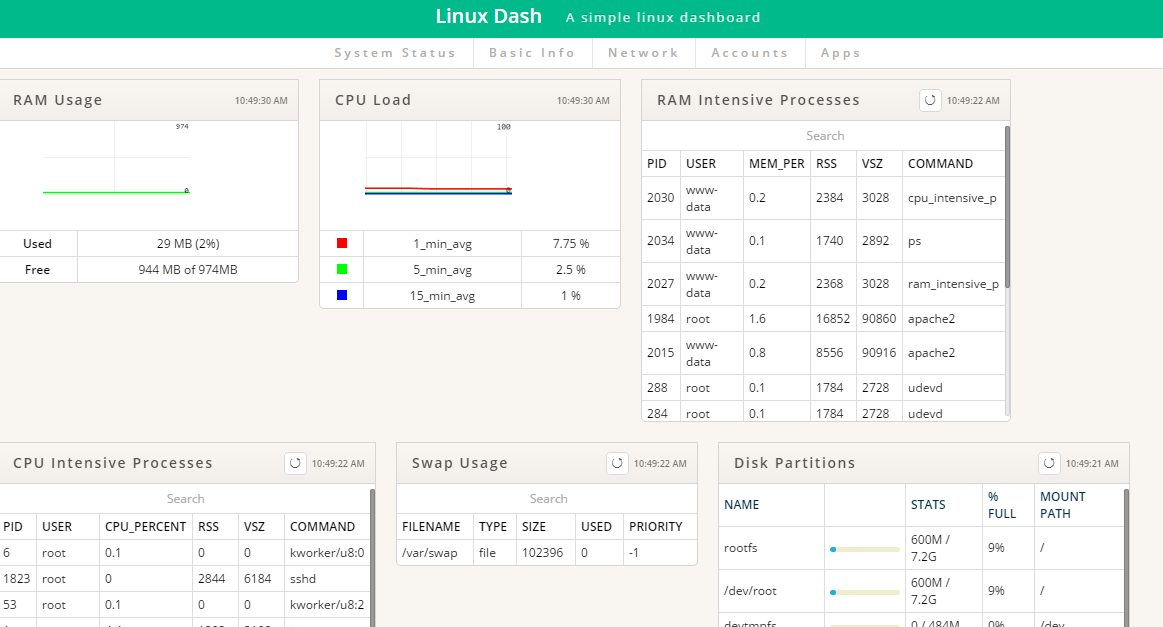
The web interface of Linux Dash can be accessed via:
- URL =
http://<your.IP>/linuxdash/app
Official documentation: https://github.com/afaqurk/linux-dash/wiki
phpSysInfo
Allows you to monitor your system stats from a web page. The display output can be customized via an .ini file.
- Also Installs: LASP webserver stack
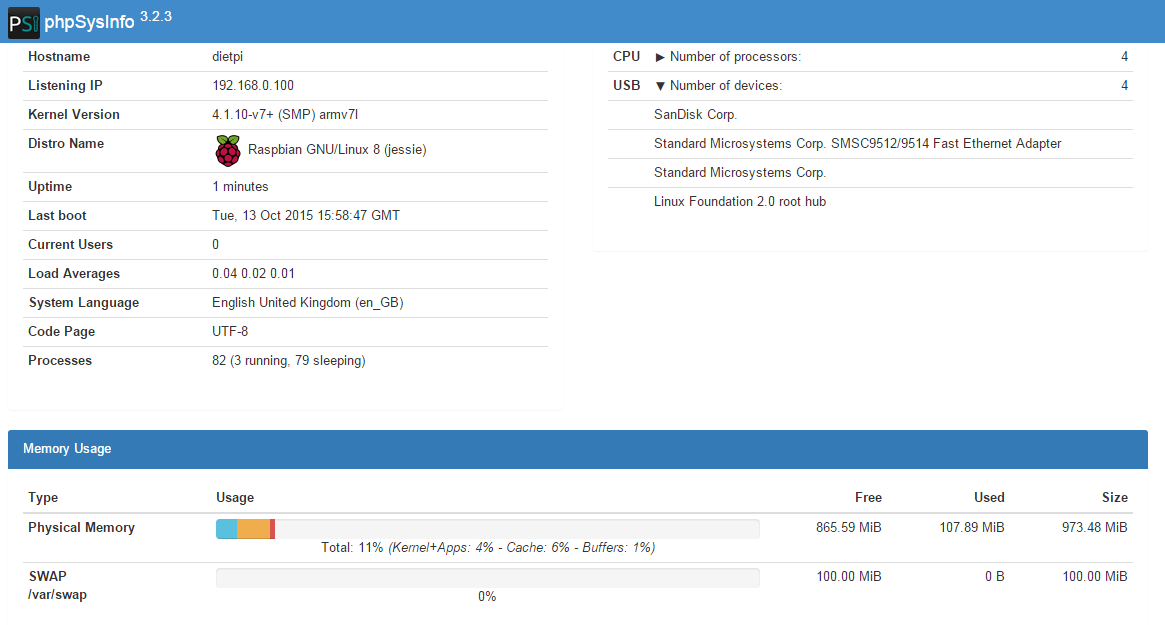
The web interface of phpSysInfo can be accessed via:
- URL =
http://<your.IP>/phpsysinfo
This is done via the file phpsysinfo.ini which is located in the phpSysInfo main directory (typical /var/www/phpsysinfo). An example file phpsysinfo.ini.new is present and gives inline information about all configuration options. Just walk through this file and discover all these bells an whistles.
Official website: https://phpsysinfo.github.io/phpsysinfo
RPi-Monitor
RPi-Monitor is a slick, lightweight system stats monitor with web interface.
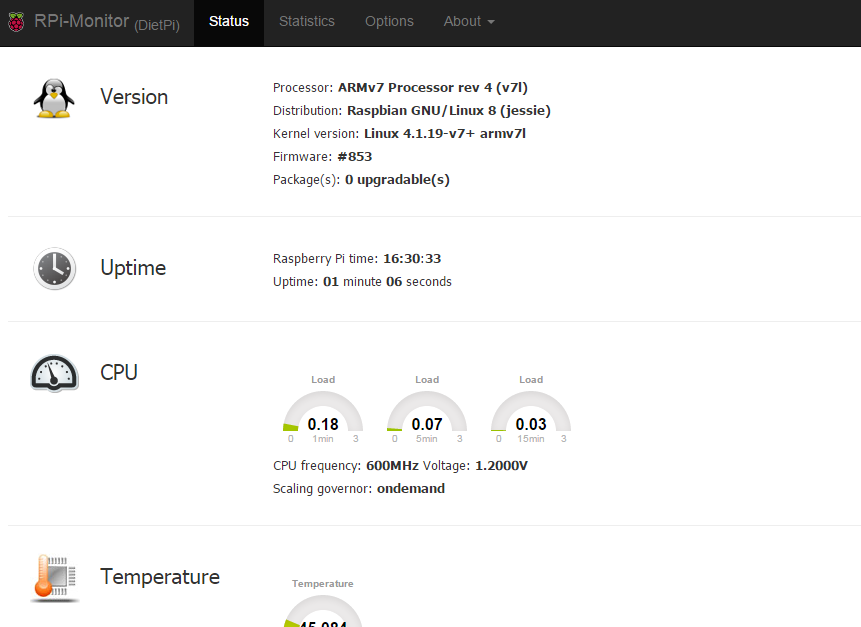
The main features of RPi-Monitor are:
- Collecting, storing and presenting metrics
- It’s flexibly configurable
- It’s user extendable
- Metrics sharing can be done via JSON file or via SNMP
- Alert option
The web interface is accessible via port 8888:
- URL =
http://<your.IP>:8888
The configuration is described there: https://xavierberger.github.io/RPi-Monitor-docs/20_index.html
Official website: XavierBerger/RPi-Monitor.
Netdata
Netdata is a slick and feature-rich system stats monitor, with web interface.
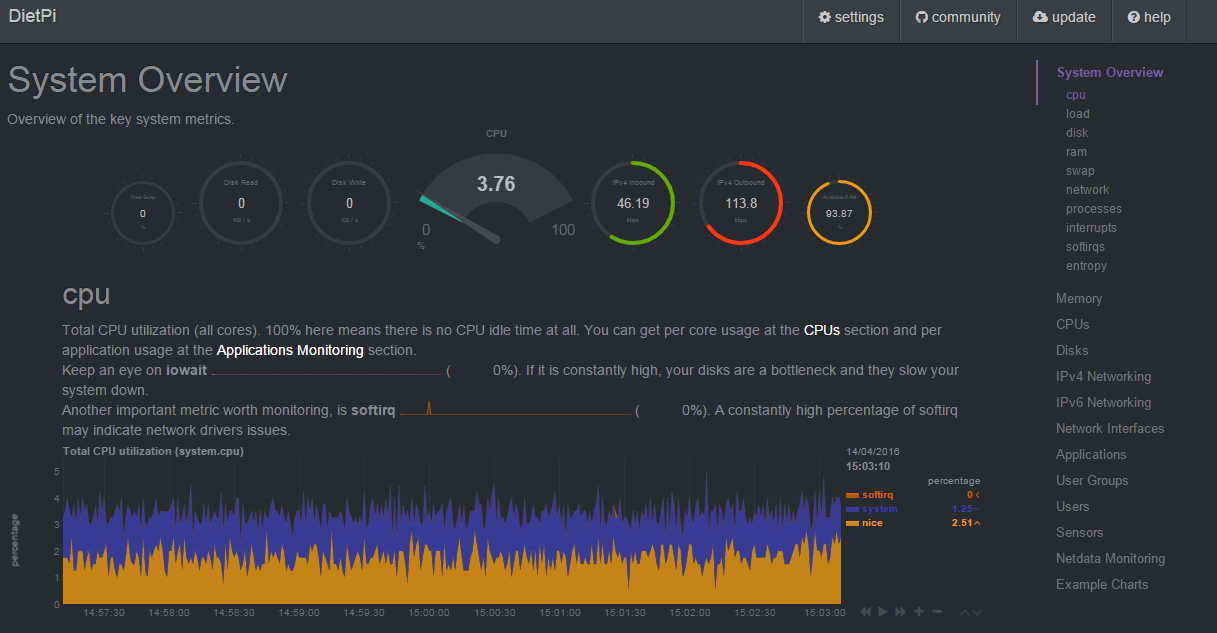
The web interface is accessible via port 19999:
- URL =
http://<your.IP>:19999
Depending on your system, by default Netdata might be not accessible from remote browsers. If this is the case, open the configuration file/etc/netdata/netdata.conf
and change the linebind socket to IP = 127.0.0.1
to match either the local network IP or static public IP of your DietPi server depending on your needs. Alternatively comment it e.g. if your server does not have a static public IP but you require remote access. But note that an unprotected publicly accessible Netdata web interface is a potential security risk. Head over to the “Security hardening” tab to learn more about how to restrict access to Netdata.
Once saved, you will need to restart the service to implement the changes by entering the below into the terminal:
systemctl restart netdata
Note that having Netdata accessible to anyone gives potential attackers a bunch of useful information where to start hacking.
To learn about how to limit access to Netdata, please refer to their documentation regarding the configuration of access lists.
Official documentation: https://learn.netdata.cloud/docs/netdata-agent/
Wikipedia: https://wikipedia.org/wiki/Netdata
Webmin
Webmin is a web-based feature-rich remote system management tool. Many system settings can easily be set using the web interface dialogues.
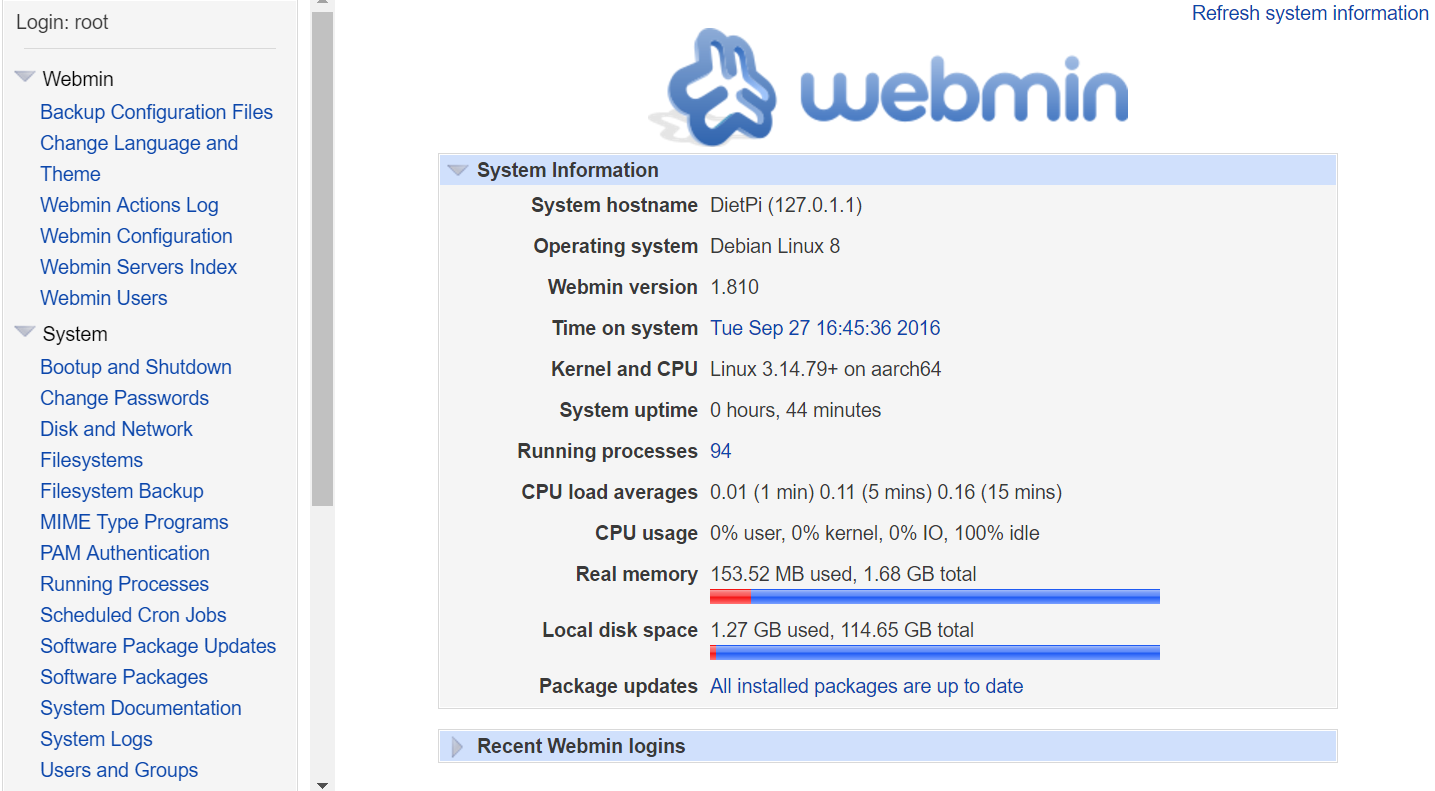
The web interface is accessible via port 10000:
- URL =
https://<your.IP>:10000 - Username =
root - Password =
<your software password>(default:dietpi)
Use HTTPS
Please ensure https:// URL is typed, http:// won’t work!
The Webmin system logging panel still depends on a classical file logger, like Rsyslog. However DietPi will not impose this logging overhead on systems by default. If you need to see system logs via the Webmin online panel, you can either configure a custom syslog daemon or install Rsyslog manually:
apt install rsyslog
DietPi comes with systemd and the related journald system logger, which can be accessed via the command journalctl.
Official website: https://webmin.com/
Wikipedia: https://wikipedia.org/wiki/Webmin
K3s
Lightweight Kubernetes - The certified Kubernetes distribution built for IoT & Edge computing
![]()
The default installation of K3s creates a single-node cluster. If you want to have a multi-node setup, you need to configure the nodes to speak to the others.
In /boot/dietpi.txt, edit the SOFTWARE_K3S_EXEC parameter to set command (server or agent). You can add other command-line parameters after the command.
Example:
SOFTWARE_K3S_EXEC=server --disable=local-storage
If you need to add many command-line parameters, it is recommended to put them in a file instead, keeping only the command (server or agent) in /boot/dietpi.txt. During installation, if /boot/dietpi-k3s.yaml exists, it is copied to /etc/rancher/k3s/config.yaml, and used by K3s. The format of this file is documented in the K3s docs.
When running in server mode, K3s generates a kubeconfig file at /etc/rancher/k3s/k3s.yaml. Copy this to your client machine, and edit the server setting to point to the hostname of the server.
Place the file in the default location (~/.kube/config), or point to it using the KUBECONFIG environment-variable.
You should now be able to interact with your Kubernetes cluster using kubectl:
kubectl get nodes
kubectl get pods -A
- Service:
journalctl -u k3s
Official website: https://k3s.io
Official documentation: https://rancher.com/docs/k3s/latest/en/
Source code: k3s-io/k3s
License: Apache 2.0
MicroK8s
High availability - Low-ops, minimal production Kubernetes, for developers, cloud, clusters, workstations, Edge and IoT.

To create a cluster out of two or more already-running MicroK8s instances, use the microk8s add-node command:
microk8s add-node
From the node you wish to join to this cluster, run the following:
microk8s join 192.168.1.230:25000/92b2db237428470dc4fcfc4ebbd9dc81/2c0cb3284b05
Use the --worker flag to join a node as a worker not running the control plane, e.g.:
microk8s join 192.168.1.230:25000/92b2db237428470dc4fcfc4ebbd9dc81/2c0cb3284b05 --worker
For most commands, you can use microk8s in front like below.
microk8s kubectl get nodes
microk8s kubectl get namespaces
MicroK8s does provide a few “addons”, which can be seen below with the enable and disable command.
microk8s status # to view the addons
microk8s enable dns # to enable addons
microk8s enable dashboard # to enable Kubernetes dashboard
Per-node log files can be in:
/var/log/pods
Official website: https://microk8s.io/
Official documentation: https://microk8s.io/docs
Addons documentation: https://microk8s.io/docs/addons
Source code: ubuntu/microk8s
License: Apache 2.0
Prometheus Node Exporter
Prometheus exporter for hardware and OS metrics. This component exposes system metrics, so they can be scraped by an external Prometheus server, which can aggregate metrics from many devices. These metrics can then be visualized through Grafana, the final piece of a very powerful monitoring stack.
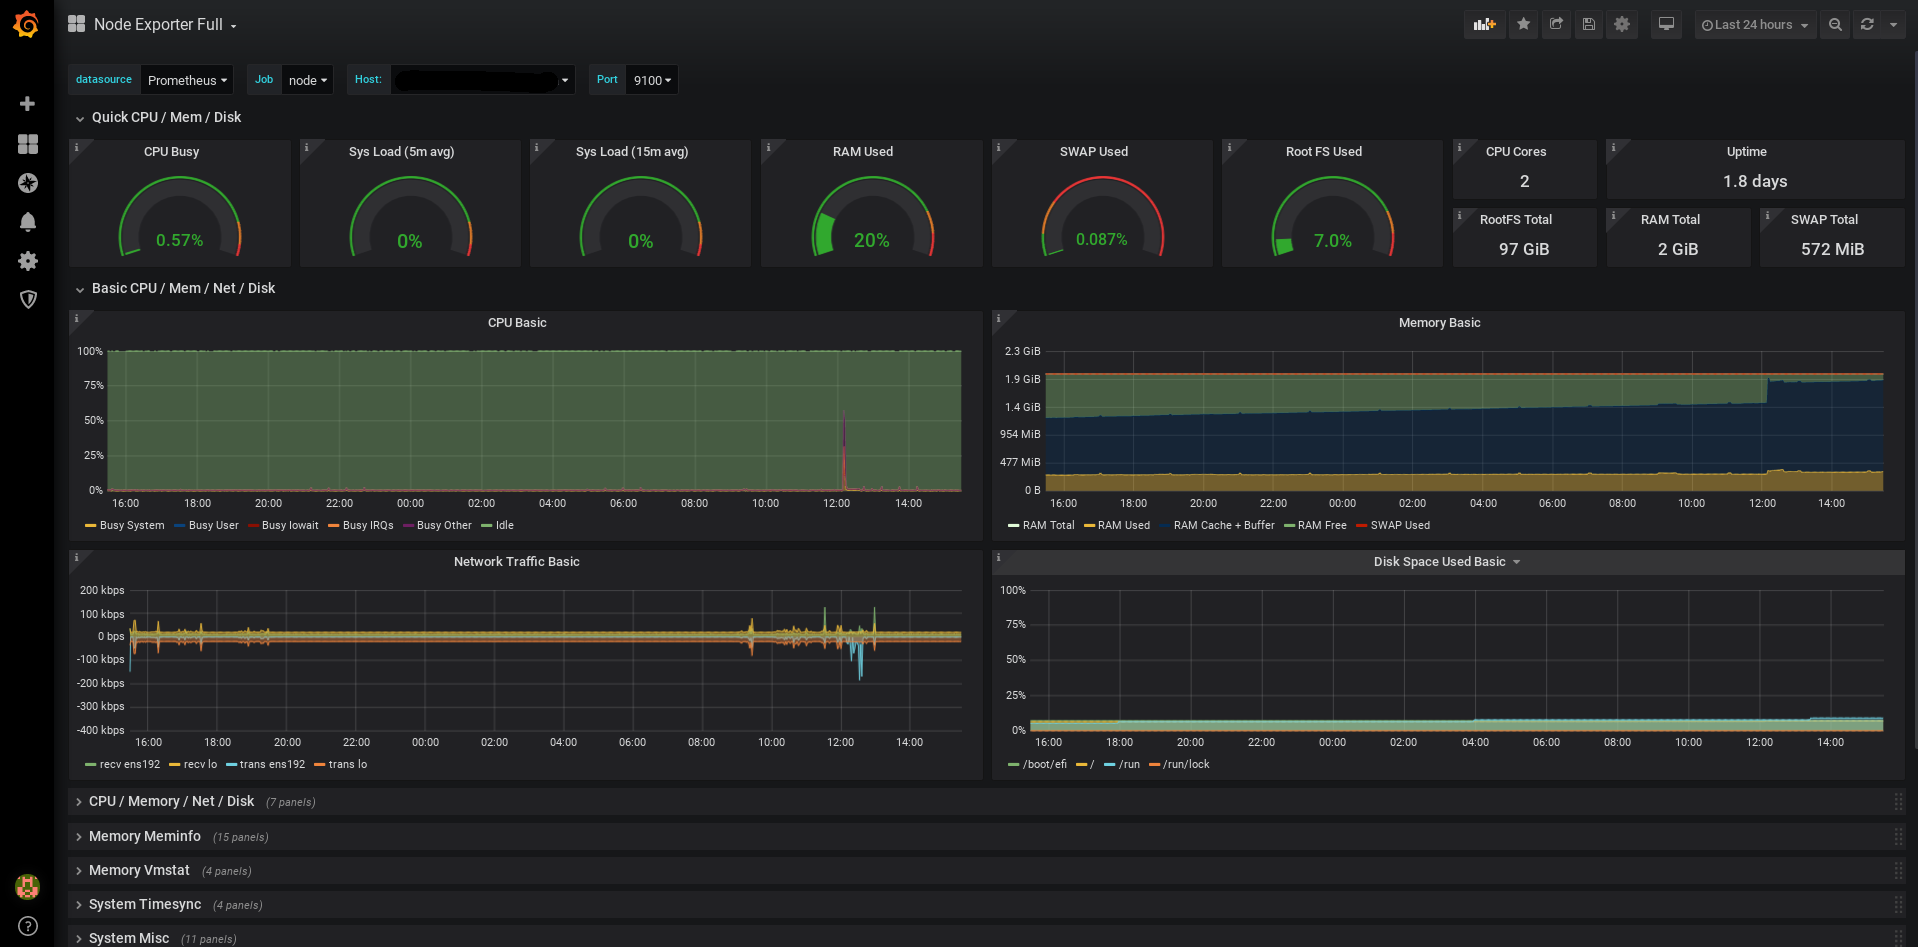
On Raspberry Pi SBCs, this software will include the Raspberry Pi Exporter, which will add RPi-specific metrics such as voltages, CPU frequencies and temperatures.
The metrics endpoint of Prometheus Node Exporter is exposed at TCP port 9100 and can be accessed via:
- URL =
http://<your.IP>:9100/metrics
Prometheus server not included
Note that this software component does not install or configure a Prometheus server, it must be installed separately.
Your Prometheus server needs to be configured in order to scrape Node Exporter metrics. Full configuration of the Prometheus server is outside the scope of this documentation, but here is a sample prometheus.yml file for reference:
global:
  scrape_interval: 15s

scrape_configs:
- job_name: your.hostname
  static_configs:
  - targets: ['your.IP:9100']
Grafana not included
Note that this software component does not install or configure Grafana, it must be installed separately.
There are many pre-made templates of Grafana dashboards for visualizing data collected from a Prometheus Node Exporter. A good starting point is Node Exporter Full. You can import it directly into your Grafana instance by using ID 1860.
Since Prometheus Node Exporter runs as a systemd service, it can be controlled with the following commands:
systemctl status node_exporter
systemctl start node_exporter
systemctl stop node_exporter
systemctl restart node_exporter
Prometheus Node Exporter runs as a systemd service, hence logs can be viewed with the following command:
journalctl -u node_exporter
Prometheus Node Exporter can be updated by simply reinstalling it:
dietpi-software reinstall 99
Official website: prometheus/node_exporter
Documentation: https://prometheus.io/docs/guides/node-exporter/
Prometheus RPi Exporter: fahlke/raspberrypi_exporter
License: Apache 2.0, MIT (for RPi Exporter)
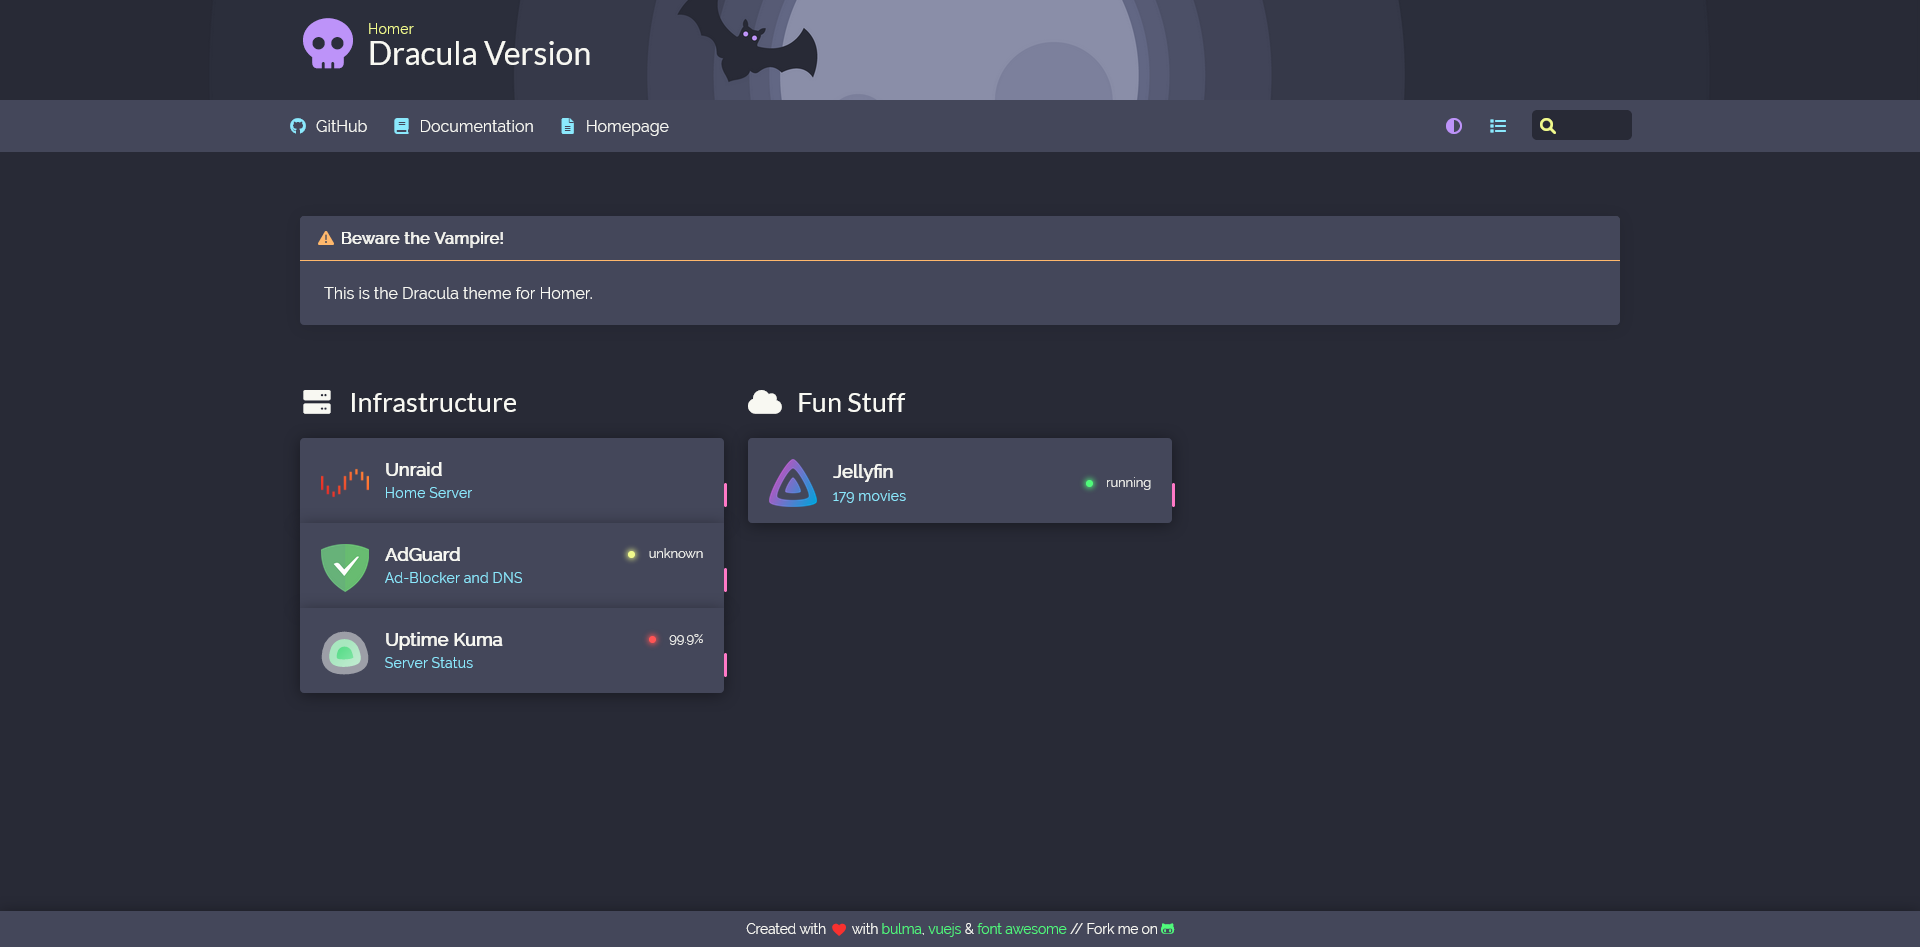
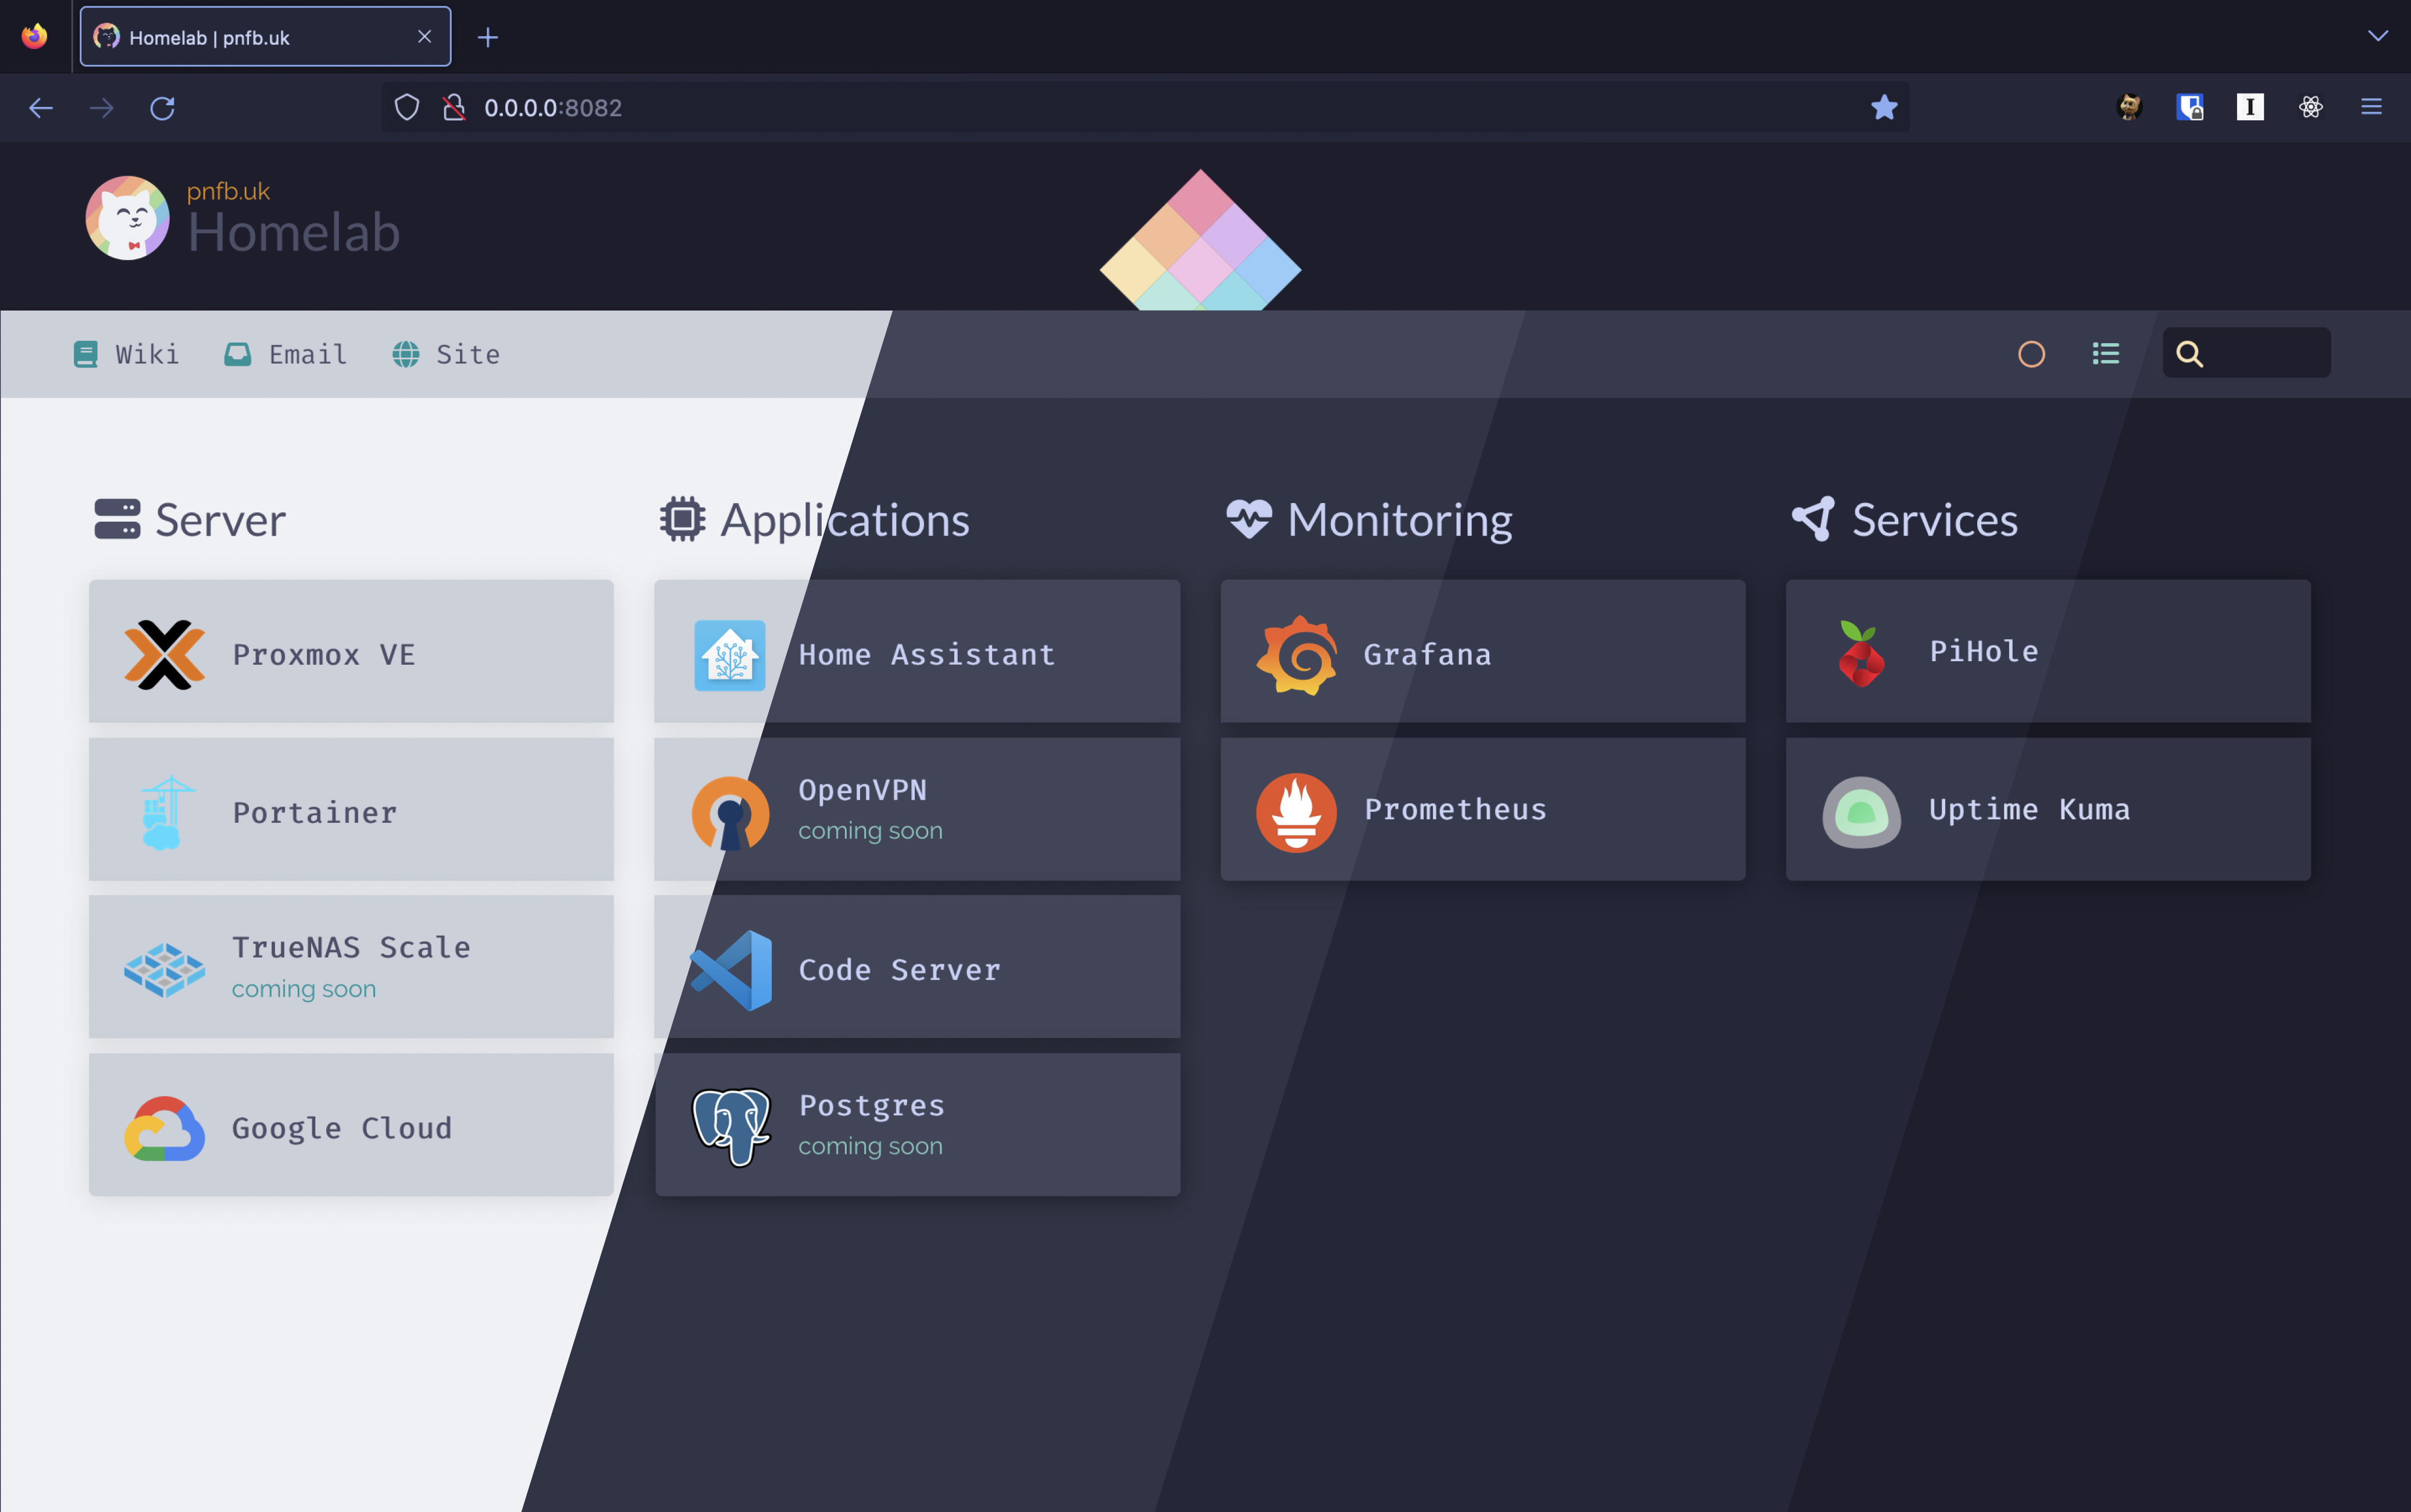
Homer
Homer is a modern and lightweight dashboard & homepage for your services
The Homer dashboard can be accessed via:
- URL:
http://<your.IP>/homer
You may bookmark this and save it as your browser’s home page, or alternatively look into tools like Nginx Proxy Manager and a DNS server such as AdGuard Home to give it a nice internal domain name such as homer.box.
To configure entries and icons for Homer, you can edit it’s config file /var/www/homer/assets/config.yml. Example contents:
services:
  - name: "Selfhosted"
    icon: "fas fa-cloud"
    items:
      - name: "Adguard Home"
        logo: "assets/icons2/adguard.png"
        subtitle: "A blackhole for the internet"
        tag: "Selfhosted"
        url: "https://adguard.box"
        target: "_blank"
      - name: "Nginx"
        logo: "assets/icons2/nginx.png"
        subtitle: "Reverse proxy - load balancer"
        tag: "Selfhosted"
        url: "https://nginx.box"
        target: "_blank"
      - name: "Shiori"
        logo: "assets/icons2/shiori.png"
        subtitle: "Web archiving + Read later"
        tag: "Selfhosted"
        url: "https://shiori.box"
        target: "_blank"
      - name: "Nextcloud"
        logo: "assets/icons2/nextcloud.png"
        subtitle: "A google suite alternative"
        tag: "Selfhosted"
        url: "https://nextcloud.box"
        target: "_blank"
In the example above, a column titled Selfhosted is being made which contains 4 entries. In the same directory as the config.yml, an icons2 folder exists, which contains icon images.
To update Homer simply re-run the installer by executing
dietpi-software reinstall 205
Remark: The dietpi-software script update procedure preserves the file config.yml automatically, there is no necessity for the user to do a restore manually.
If other files in /var/www/homer were previously changed by the user, they need to be copied in place (from the backup location /mnt/dietpi_userdata/homer_backup). As an example for a changed file manifest.json this could be done via:
cd /mnt/dietpi_userdata/homer_backup
mv manifest.json /var/www/homer/assets
To apply the Dracula theme to Homer execute these steps:
Get theme:
curl -fL 'https://raw.githubusercontent.com/dracula/homer/master/custom.css' -o /var/www/homer/assets/custom.css
curl -fL 'https://raw.githubusercontent.com/dracula/homer/master/dracula-background.png' -o /var/www/homer/assets/dracula-background.png
Edit your
config.ymlwith:nano /var/www/homer/assets/config.ymlAdd the following lines:
# Will load Dracula theme
stylesheet:
- "assets/custom.css"
Source code: dracula/homer
To apply the macOS styled theme to Homer execute these steps:
Get theme:
cd /tmp
curl -fLO 'https://github.com/walkxcode/homer-theme/archive/main.tar.gz'
tar xf main.tar.gz
rm main.tar.gz
cp homer-theme-main/assets/custom.css /var/www/homer/assets/custom.css
cp homer-theme-main/assets/wallpaper.jpeg /var/www/homer/assets/wallpaper.jpeg
cp homer-theme-main/assets/wallpaper-light.jpeg /var/www/homer/assets/wallpaper-light.jpeg
cp -R homer-theme-main/assets/fonts /var/www/homer/assets/
rm -R homer-theme-main
Edit your
config.ymlwith:nano /var/www/homer/assets/config.ymlAdd the following lines (make sure to remove content for colors, theme, and columns if they previously existed):
stylesheet:
- "assets/custom.css"

columns: "3" # You can change this to any number that is a factor of 12: (1, 2, 3, 4, 6, 12)
theme: default
colors:
  light:
    highlight-primary: "#fff5f2"
    highlight-secondary: "#fff5f2"
    highlight-hover: "#bebebe"
    background: "#12152B"
    card-background: "rgba(255, 245, 242, 0.8)"
    text: "#ffffff"
    text-header: "#fafafa"
    text-title: "#000000"
    text-subtitle: "#111111"
    card-shadow: rgba(0, 0, 0, 0.5)
    link: "#3273dc"
    link-hover: "#2e4053"
    background-image: "../assets/wallpaper-light.jpeg" # Change wallpaper.jpeg to the name of your own custom wallpaper!
  dark:
    highlight-primary: "#181C3A"
    highlight-secondary: "#181C3A"
    highlight-hover: "#1F2347"
    background: "#12152B"
    card-background: "rgba(24, 28, 58, 0.8)"
    text: "#eaeaea"
    text-header: "#7C71DD"
    text-title: "#fafafa"
    text-subtitle: "#8B8D9C"
    card-shadow: rgba(0, 0, 0, 0.5)
    link: "#c1c1c1"
    link-hover: "#fafafa"
    background-image: "../assets/wallpaper.jpeg"
Source code: walkxcode/homer-theme
To apply the Catppuccin theme to Homer execute these steps:
Get theme:
apt install git
git clone https://github.com/mrpbennett/catppucin-homer
Choose one of the
cssfiles, they all have varying colour schemes, and copy it to Homer, for example thecatppuccin-macchiatostyle sheet:cp catppuccin-homer/flavours/catppuccin-macchiato.css /var/www/homer/assetsEdit the
config.ymlfile with:nano /var/www/homer/assets/config.ymlAdd the following lines (change
macchiatoto the wanted theme):# Will load catppuccin theme. stylesheet: - "assets/catppuccin-macchiato.css"
Source code: mrpbennett/catppucin-homer
Official website: bastienwirtz/homer
Official demo: https://homer-demo.netlify.app/