With DietPi 7.8, DietPi-Dashboard was initially added. This lightweight web dashboard allows you to take advantage of some features offered by your DietPi system, all from your browser.
Main features
The main features of the DietPi Dashboard are
- Display the load (CPU, RAM, disk, network) and show a time series line chart
- Display and control the services and running processes
- Installation and removal of software packages (like
dietpi-software) - Have a terminal session
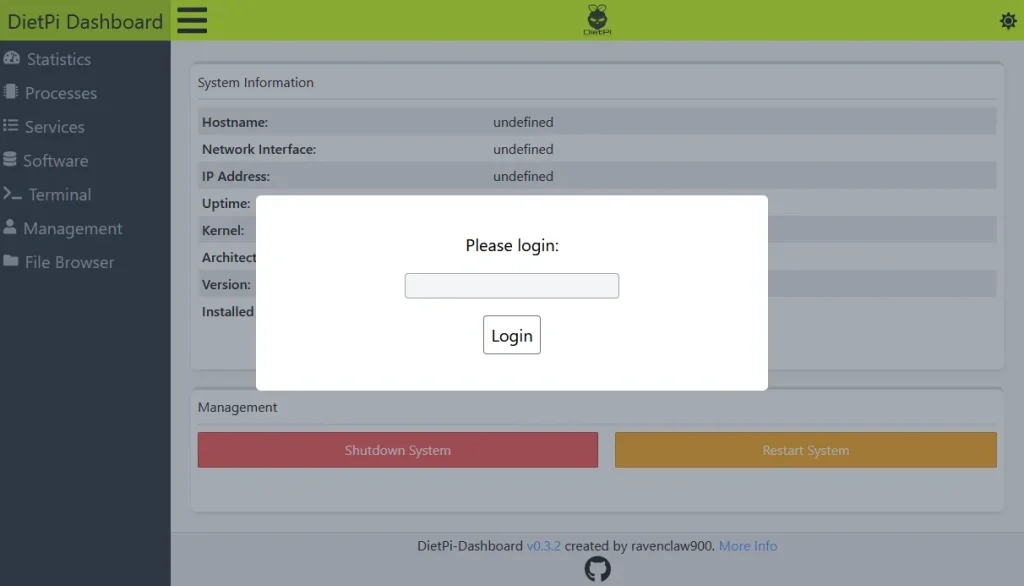
- System information with shutdown and restart control
- File browser
- Dark/Light theme
- Viewing of multiple devices on the same page
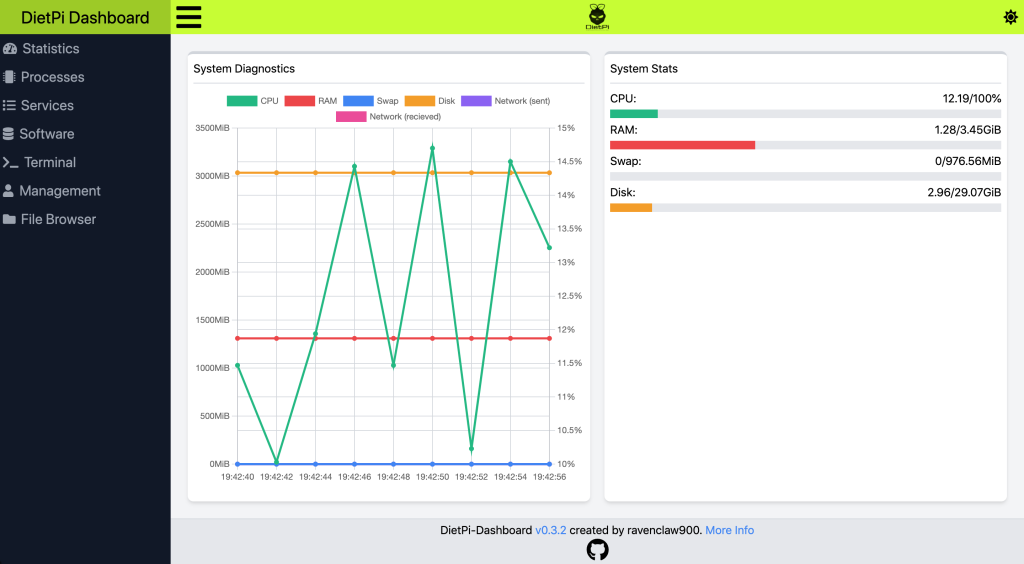
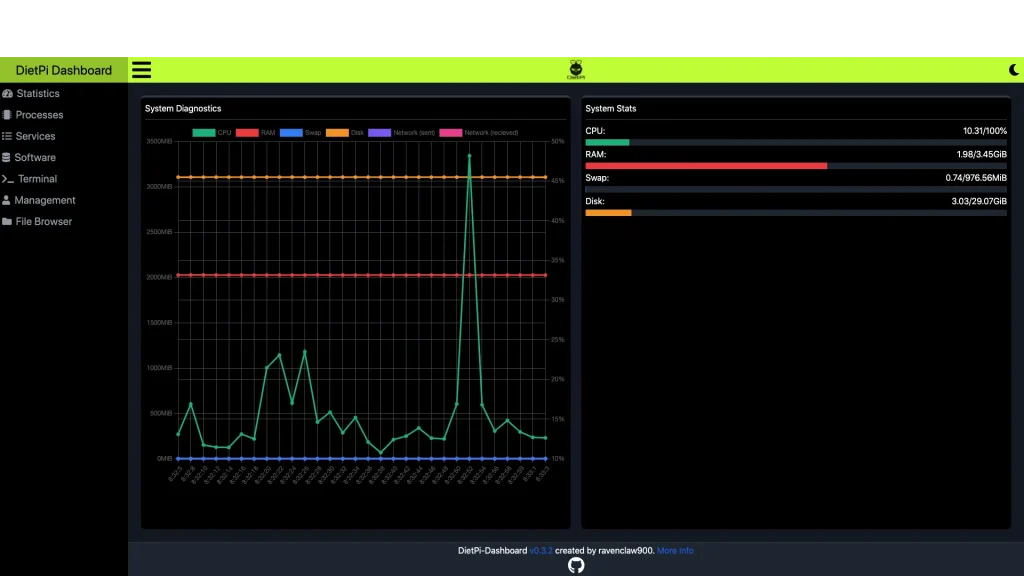
Statistics
The main page shown to you by the dashboard, it lets you see many basic statistics about your system, including swap, RAM, CPU, disk, and network usage.
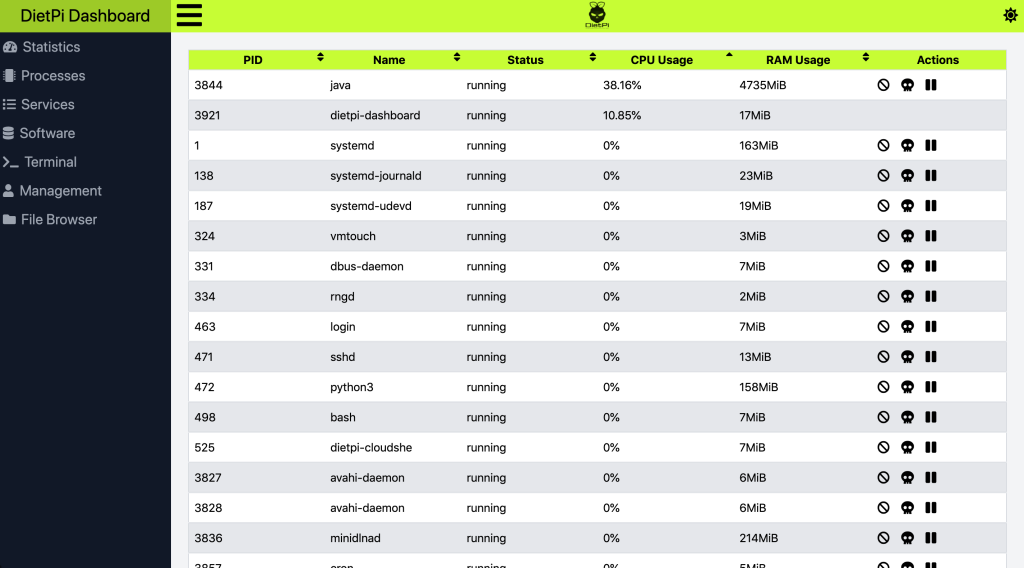
Processes
This page lets you view, sort, and control currently running processes.
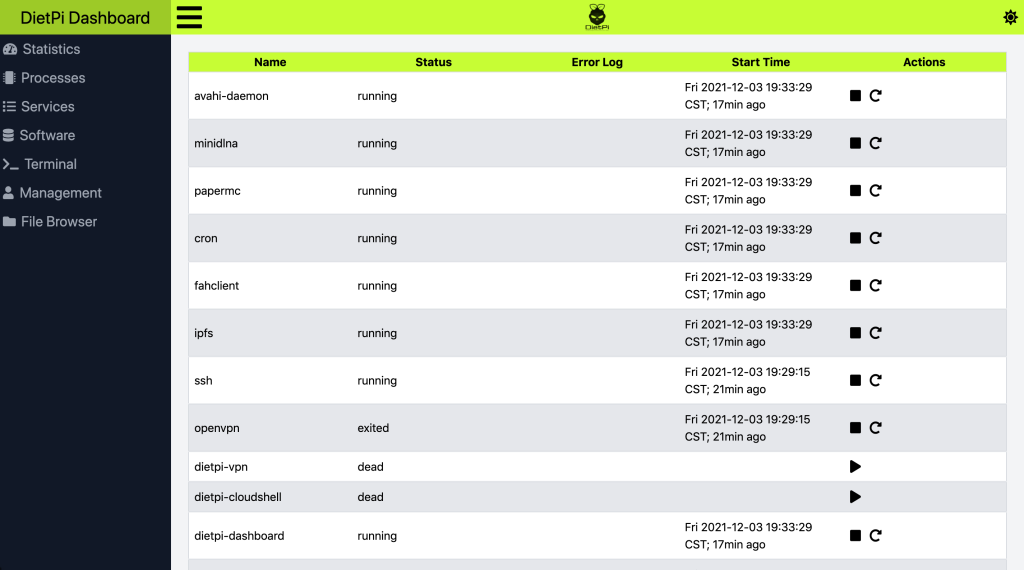
Services
This page lets you view and control running and stopped services.
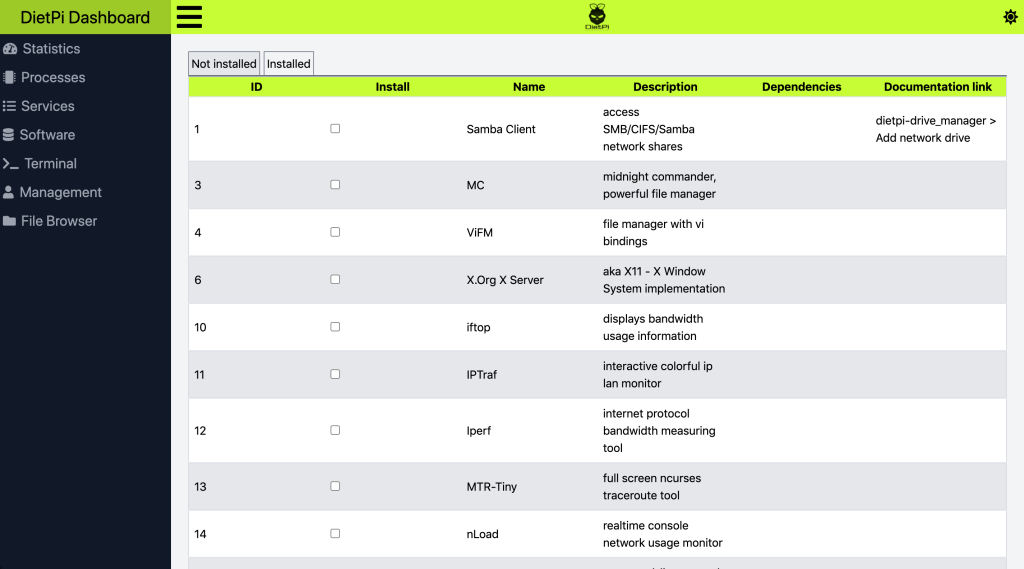
Software
This page lets you install and uninstall software (like dietpi-software). Note that, currently, only software that can be installed without interaction can be installed through the software page. If you need to install software that does require interaction, open the Terminal page and run dietpi-software from there.
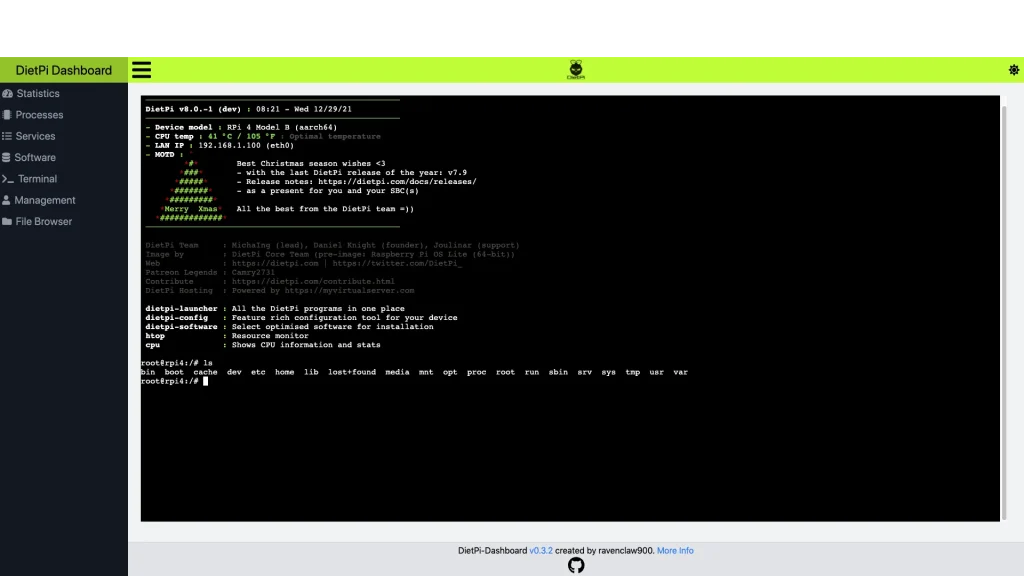
Terminal
This page gives you access to a root terminal from your browser.
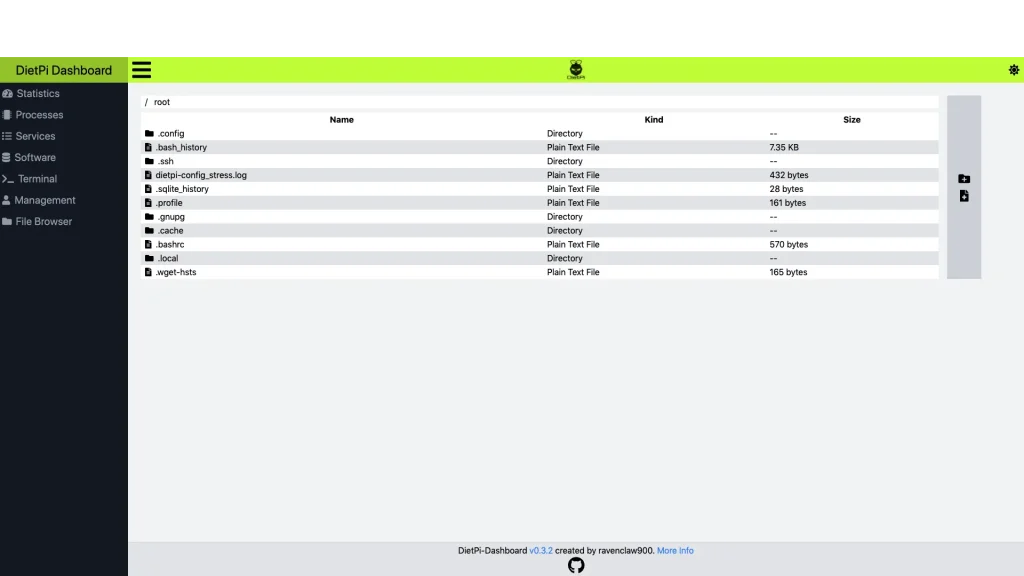
File Browser
This page lets you edit, rename, delete, and create files and directories.
DARK/LIGHT MODE
DietPi Dashboard has a dark and a light mode.
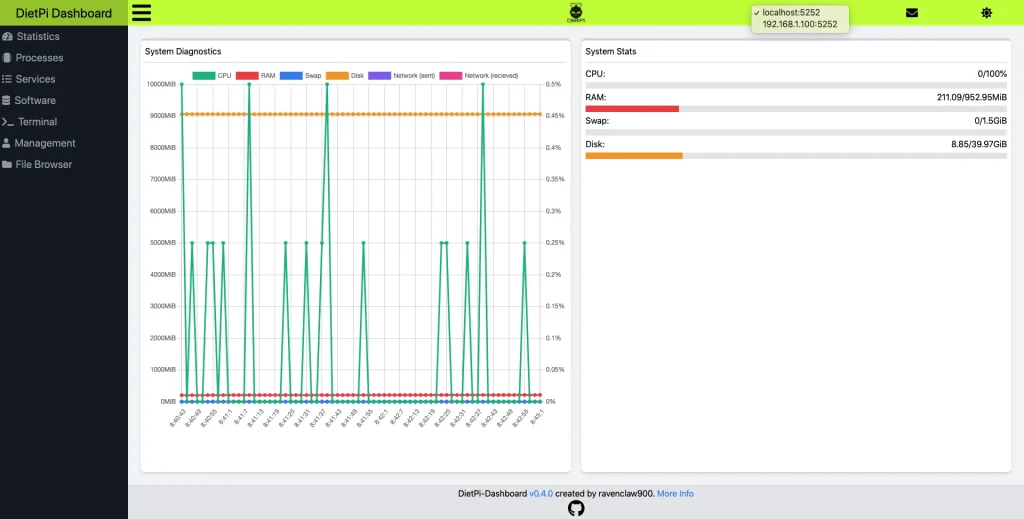
Multiple Nodes
You can also use the dashboard for multiple different devices, on the same page. This requires the other instance to be installed as “backend only”, which can be selected from DietPi v8.0 on, currently in beta: https://github.com/MichaIng/DietPi/issues/5137
Password protection
Since DietPi v7.9, password protection was added to the DietPi Dashboard.
Thanks for the password protection, but can I disable it somehow? 🙂
Sure, in /opt/dietpi-dashboard/config.toml change “pass = true” to “pass = false” and restart the service “systemctl restart dietpi-dashboard”.
Very nice. I like the dark template (y)
I have 2 additional storage devices attached to my pi.
Would be nice, seeing all drives besides / 😉
Thanks for your kind feedback. Jep, a dark mode was one of the first things I asked for as well, being probably a little crazy on dark modes in general, being sad that this blog doesn’t have one :(.
You should find your mounts in /mnt or /media, depending on where you mounted them? Unlike on Windows, all drives are mounted somewhere belog root /.
I dont know if its me or what but my graphs all reset every time i reload the page. Is that normal?
That is expected. There is usually no need to reload the page, which also is not done when navigating through the pages. Probably there would be the possibility to store the measurement points in browser storage to be reloaded when reloading or revisiting the page. But you would have a gap (since we do not want to keep obtaining data while you are on a different page) and that would mean a potentially huge amount of data in browser storage when having that page opened on some kiosk mode LCD screen or such, for persistent monitoring. At least we’d need to have a max age to drop old data then.
oh… my network is also crossed off. i am going to make a guess that this is because i am using a pc instead of a pi. would it help if i compiled it from source on my machine?
Not sure what you mean by “crossed off”? DietPi-Dashboard is installed for whatever architecture the system is, so on your PC you’ll have the x86_64 build installed, on a Pi an ARM build. There is no benefit of compiling it yourself unless you want to set custom flags, change the source code or so.
I thought they had a line through them in de ledgend at the top of the statistics graph. They do not but they don’t show on the graph either. I installed dietpi using the script after installing debian 11 on the machine. I was wondering if compilimg from source would help because the system is not a standard dietpi image.
Thanks for your hard work! Is there any way to set up the graph to show the remaining space on other mounted drives?
Not currently, the root drive is hard-coded in. However, this shouldn’t be too hard to implement, I’ll add it to the 1.0.0 roadmap.
I can’t see network usage.
Dietpi version 8.3.1
Dietpi-dashboard version 0.5.1
Board: RockPi S
Is it probably just close to zero, so that it’s hidden below e.g. the swap size at the horizontal axis, like or similar to the screenshot above?
Would be an idea to allow hiding individual graphs and/or using different vertical axis scale for RAM/swap usage and network/disk I/O.
Now I realised this is possible already :D.
Awesome, nice work! I just seen this and installed right away and I love it!!!!
Many thanks for your kind feedback. Let us know what we can do when better.
A really nice app. I am new here and would like to ask if it is possible to configure nginx to act as reverse proxy and access the dashboard by the url http:///dashboard
Very cool project, I would like to use this ! I was wondering how I could use this with letsencrypt. Because of letsencrypt, I can’t connect on http but only on https. Hence, I am not able to acces this web dashboard.
You should be able to use the “tls”, “cert”, and “key” settings in the config file at “/opt/dietpi-dashboard/config.toml”
Thank you !
Is it possible to implement this Dashboard in a Docker Container?
So there would be no outgoing Ports and the SSL Certs could deploy the Reverse Proxy from Traefik or Nginx Proxy Manager.
This is currently not possible: The dashboard directly executes commands and DietPi scripts from its host system, so it would require a DietPi system inside the container, and you would monitor and manage the container, not the container’s host ;). You could use a firewall to block all requests but from localhost to the port, and then use a reverse proxy. I just opened a feature request for subnet binding, so no firewall would be required anymore: https://github.com/ravenclaw900/DietPi-Dashboard/issues/221
Another issue is that you cannot currently use sub directory for accessing the dashboard from the reverse proxy, but a sub domain would be required: https://github.com/ravenclaw900/DietPi-Dashboard/issues/113
Thanks, this is a handy little app,
maybe it’s possible to add vcgencmd measure_temp to “System Stats”
Already in progress: https://github.com/ravenclaw900/DietPi-Dashboard/pull/232.
It’s a very nice app!
There’s little info about it though. I finally saw that it could be accessed through port 5252.
Now I see that part of the config is in the application’s Cargo.toml file (which is strange). What login’s password does it use? I changed a few defaults but it doesn’t seem to change the “dietpi” default password for this app.
I recommend enabling TLS for this.
The config.toml contains the password hash only + instructions about how to generate it from the plain text password. Depending on with which version you installed the dashboard the first time, related comments might be missing. Please have a look here: https://github.com/ravenclaw900/DietPi-Dashboard/blob/main/config.toml#L16-L25
Yes TLS is definitely recommended for a remote admin interface like this, at least if you make it accessible to www or have no strict LAN firewall, strong WiFi keys, no or separate guest network and such ;).
The multiple nodes (aka backend only) is a nice feature. I use it to reduce memory usage on one of my RPis and host the frontend on another RPi that is under less stress.
In order for it to work, the node with the frontend must be configured to access the other dashboard.
Open `/opt/dietpi-dashboard/config.toml` and edit the nodes, e.g. `nodes = [“192.168.1.100:5252”]`.
Then restart dietpi-dashboard with `systemctl restart dietpi-dashboard`.
Tip: Remember you can SSH into the dietpi host to do this to avoid connecting I/O devices to the RPI.
user management please
can anyone please help
I am trying to install pihole using dietpi dashboard
but it keeps loading on install button at the bottom and no result
It would be best to post this in our forum: https://dietpi.com/forum/ which is the main area where the quickest assistance is given.
thx.
Hello,
any way to look at historic data? e.g. cpu temperature/usage trends of a day or week.
Thank you!
At the moment data is stored nowhere but in your browser’s local store, for a single session, only while you visit the dashboard. So no, no historic data are stored and not even live data recorded in background. That would require an additional service wich constantly records data in the background, independently of actual dashboard visits. We’ll see how far we want to go into such monitoring direction. For now other tools like Netdata can do that.
software page would be really nice if it showed current and available version. also possibly update buttons for dietpi OS and other installed softwares
The way
dietpi-softwarecurrently works this is basically impossible. It often does not even obtain the software version but e.g. just an URL or installs/upgrades an APT package right away. Note that it is not us who provide the software packages (aside of in a few exception) but either Debian or the software developers themselves, or it is compiled from sources in place, so there is no consistent method to obtain a current version. Also the method to update the software differs the same way and a reinstall is not always the best (or even possible) option to do that.A DietPi update button would be possible in the way that the terminal is opened and the
dietpi-updatecommand passed.Not sure if it’s possible but alerts for a service that is down or cpu high etc would be a cool feature.
If you mean email notifications: This would not be a dashboard feature but a DietPi core feature. There is a request for this, but nobody started working on it yet: https://github.com/MichaIng/DietPi/issues/2663
Hi, this runs beautifully on my simple, out-of-the-box standard raspberry pi 2. Thank you. As a noob I really appreciate plug and play implementations like this, especially the build in terminal makes my life a lot easier.
I have a question though; the network lines in the dashboard itself stay flat for upload and download, even after extensive load on the network where I do see the ramp-up of the cpu. Any thoughts on where m should start looking?
Additionally, if you are looking for additional features, it would nice that after a re-logon there would be some sort of buffered graph (I.e. last 5 minute history buffer?) that is initially shown for (some of?) the graph-lines.
Cool stuff, txs.
Thanks, I’m glad you like it. The reason that you can’t see the network on the graph is just because of the way it’s scaled: the gigabytes of disk space are always going to overshadow the kilobytes of network traffic, even at max load. This should be fixed next release, as the graph will use a log scale to appropriately show all values, and disk space will be removed from the graph.
Currently a buffer is not possible as the data for the graph is fetched on-demand and only stored temporarily in the browser. To be able to see previous data, the dashboard would always have to be collecting data and storing it on the device, so that it could be sent to the browser along with the current data.
For now, it should be possible to better see network traffic when you deselect all other bytes scale graphs.
how do you make the default terminal user to not be root?
How do we turn off the utterly dreadful dark mode?
I manage multiple nodes and was wondering if there’s a way to display names for them instead of their IP addresses?
Not able to install dietpi-dashboard (200) anymore. Getting a ERROR CODE 22
This is happening on the latest release as well as on an older release
Hi, great job, just installed and works great (Pi3B+ audio player)
Suggestion: add a shutdown / restart “button”
Of course possible to manage with the Terminal but a bit “cumbersome”.
Btw what is the “postal envelope symbol” on the top (right side) good for ?
Except adding some space betweed the header and the main display I was not able to find out.
Hello!
Thank you for the feedback, I’m glad you’re enjoying the dashboard. I’m assuming you’re talking about a shutdown button for the system? That’s a feature present on older features of the dashboard but that was removed in the rework. Funnily enough I just put in space for it last night, so I’ll add it very shortly.
Hello, thanks for your reply, and yes that’s correct, a shutdown button 🙂
Great if you intend to re-include it here !
If I’m right, for the dashboard update:
dietpi-software reinstall 200 (or the current SW Nr. in DietPi’s list)
systemctl restart dietpi-dashboard-frontend
systemctl restart dietpi-dashboard-backend
Just starting out and this looks really helpful! Thanks.
I notice that the File Browser feature allows me to upload a single file at a time. Is there a plan to add uploading multiple files or, better yet, uploading a whole folder of files?
I’m using v0.7.0.