I think that it’d be great if you could add a USB HDD monitor to RPi Monitor, like so:
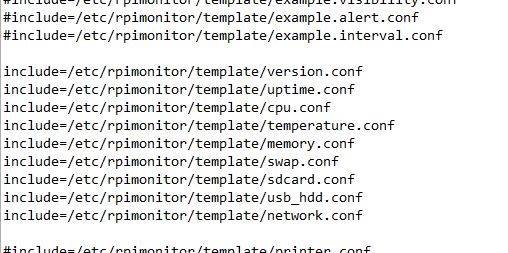
When installing RPiMonitor, check to see if a USB hard drive is being used for storage, then add the line include=/etc/rpimonitor/template/usb_hdd.conf after the line for sdcard.conf (scroll to the bottom):
########################################################################
#
# KPI extraction configuration
#
#  This part of the configuration file is defining which data to
#  extract how to extract them and when.
#
#  Specific 'include' keyword is available to add a file at the end of
#  the list of configuration files to be loaded.
#
#  include=<full path to configuration file>
#    <full path to configuration file> is the full path to the
#    configuration file to add at the end of the list of configuration
#    files to be loaded.
#
#  Static KPI are extracted once at rpimonitord startup. Each statistic
#  is identified into the conf file by a line stating with the keyword
#  static and an identifier <static data id>
#
#  Each static KPI is defined by an id and with 4 parameters
#
#  static.<static data id>.name=<data name>
#    <data name> is a string representing the KPI or the list of KPI
#    separated by comma. Each name has to be unique.
#    Only alpha numerical charter and underscore are accepted.
#
#  static.<static data id>.source=<data source>
#    <data source> is a file or an executable file within the path.
#    If the file exists, rpimonitord will read its content. If the file
#    is not existing, rpimonirotd will try to execute it and will parse
#    the output.
#    Warning: specifying an executable by its absolute name will tell
#    rpimonitord to read the content of the executable.1.graph.
#
#  static.<static data id>.regexp=<data regexp>
#    <data regexp> is the regular expression extracting information from
#    data source. Regexp groups () has to be used to extract the data
#    In case of KPI list, each group will be affected to a KPI name.
#
#  static.<static data id>.postprocess=<data postprocess>
#    <data postprocess> is an expression defining the postprocessing to
#    be applied on result. KPI are idendified by $1. In case of list,
#    other KPI are identified by $2, $3 .graph..
#    This parameter will be evaluate by the command eval of perl.
#
#  Dynamic KPI are extracted periodically (defined by daemon.delay)
#  Each statistic is identified into the conf file by a line stating
#  with the keyword dynamic and an identifier <dynamic data id>
#
#  Each dynamic KPI is defined by an id and with 5 parameters
#
#  dynamic.<dynamic data id>.name=<data name>
#  dynamic.<dynamic data id>.source=<data source>
#  dynamic.<dynamic data id>.regexp=<data regexp>
#  dynamic.<dynamic data id>.postprocess=<data postprocess>
#    <data name>, <data source>, <data regexp>, <data postprocess>
#    This 4 first parameters have the same signification as for static
#    parameters.
#
#  dynamic.<dynamic data id>.rrd=<|GAUGE|COUNTER|DERIVE|ABSOLUTE|COMPUTE>
#    The 5th parameter is defining if the KPI has to be stored into a RRD
#    database and how <|GAUGE|COUNTER|DERIVE|ABSOLUTE|COMPUTE>. If the
#    parameter is defined as empty, no RRD database will be created. If
#    this parameter is defined, a RRD database will be created and data
#    will be stored at every extraction.
#    Ref http://oss.oetiker.ch/rrdtool/doc/rrdcreate.en.html for RRD
#    parameter description.
#  dynamic.<dynamic data id>.min=<minimal value acceptable in RRD>
#  dynamic.<dynamic data id>.max=<miximal value acceptable in RRD>
#    If a value extracted by is less than minimal of greater than maximal
#    value, it will be stored int RRD database as unknown.
#    These limits are usefull to handle counter that fall down to 0 when
#    they reach their limit (Ex: network graphs)
#
#  Note: Static values are accessible for the post processing using the
#  variable $this->{'static'}->{'static_data_name'} and can be used.
#  You can refer to swap data extraction to see an example.
#
########################################################################
#
# Web interface configuration
#
#  Friends are defining a displayed name and a link reachable from a
#  top left menu visible if at least one friends is configured. Each
#  friend is identified by its <id> and is described by the 2 following
#  parameters
#
#  web.friends.<id>.name=<display name>
#  web.friends.<id>.link=<link to RPi-Monitor>
#
#  web.friends.<id>.name=<display name>
#    <display name> is the name printed into the drop down menu
#
#  web.friends.<id>.link=<link to RPi-Monitor>
#    <link to RPi-Monitor> is the link to another RPi-Monitor running
#    into the friend machine.
#
#  web.page.icon=<icon location relative to webroot>
#    <icon location relative to webroot> is the path and filename of
#    the icon to be displayed into RPi-Monitor title bar
#
#  web.page.menutitle=<menu title>
#    <menu title> javascript code defining the text displayed into
#    RPi-Monotor title bar. This code can use status information with
#    the keyword 'data' including the 'data.hostname' available natively
#
#  web.page.pagetitle=<page title>
#    <page title> javascript code defining the text displayed into
#    tab and window title bar. This code can use status information with
#    the keyword 'data' including the 'data.hostname' available natively
#
#  The status page is fully configurable.
#  It is possible to define multiple pages. Each page is identified by
#  its <page id>.
#
#  web.status.<page id>.name=<page name>
#    <page name> name of the page displayed into the drop down menu in
#    case of multiple pages.
#
#  Status page is split in strips displaying information. Each status
#  strip is identified by a unique <status id>. Each status strip is
#  defined by a name, an icon and a serie of lines described as follow:
#
#  web.status.<page id>.visibility=<visibility formula>
#
#  <visibility forlula> should be a valid javascript formula returning
#    0: to hide the row
#    anything else but 0: show the row
#
#  web.status.<page id>.content.<status id>.name=<display name>
#  web.status.<page id>.content.<status id>.icon=<display icon>
#  web.status.<page id>.content.<status id>.line.<line number>=<parameter>
#
#  web.status.<page id>.content.<status id>.name=<display name>
#    <display name> Name displayed as title of the strip
#
#  web.status.<page id>.content.<status id>.icon=<display icon>
#    <display icon> Icon of the strip
#
#  web.status.<page id>.content.<status id>.line.<line number>=<parameter>
#    <line number> represent the position of the line within the strip.
#    This number has to be unique within the strip.
#    <parameter> is describing the content of the line. This parameter
#    will be evaluated by the javascript command with the function
#    eval() theirfore parameter should be valid javacript.
#    To have  clean rendering, RPi-Monitor web interface provides some
#    functions that could be used inside the parameter. The object data
#    is also available and contains the result of dynamic and static
#    extracted as described in the KPI extraction section.
#
#    Functions provided by RPi-Monitor are the following:
#
#       Uptime(uptime in sec)
#         Print the uptime from seconds to the following format:
#         XX year XX days XX hours XX minutes XX seconds
#
#       Pad(value)
#         Add a prefixed 0 for number smaller than 10
#
#       KMG(value, pre)
#         Print value in kilo, Mega, Giga, Peta.
#         pre can be 'k', 'M', 'G' or 'P' depending on the value.
#
#       Percent(value,total)
#         Print percentage of value compared to total
#
#       ProgressBar(value,total,warning, danger)
#         Draw a progressbar representing the value compared to total.
#         [=========------------]
#         The default color of pregressbar is blue.
#         If warning value is lower than critical, progressbar color will
#         be orange if percentage is higher than warning value and red
#         if the percentage is higher than danger value
#         If warning value is higher than critical, progressbar color will
#         be orange if percentage is lower than warning value and red
#         if the percentage is lower than danger value
#
#         GageBar(title, label,min, value, max, width, height, levelColors, warning, critical)
#         Draw a half-circular gauge
#         title       : Title of the gauge (located on to of the gauge)
#         label       : Label of the gauge (located under the value)
#         min         : min value of the gauge
#         value       : value to be drawn
#         max         : max value of the gauge
#         width, height : size of the gauge
#         levelColors : Array defining colors of each level [normal,warning,critical]
#                       (in Hex format), default: green, orange and red.
#                       Default colors are available into the array 'percentColors'.
#         warning     : Warning level (in %) used to define color (default: 33)
#         critical    : Critical  level (in %) used to define color (default: 66)
#
#       Plural (value)
#         Print 's ' if value > 1 or ' ' if not.
#
#       Clock(data.localtime)
#         This function is a little bit particular and should be written
#         and should be written exactly as in the upper line. It will
#         display on screen the current time and will simulate the
#         seconds by incrementing them periodically.
#
#       Label(data,formula, text, level)
#       Badge(data,formula, text, level)
#         This function will write a label/badge with a defined
#         background color if the formula return TRUE.
#         data    : data to use with the formula
#         formula : formula evaluated in regards to data to determine
#                   if label/badge has to be printed
#         text    : text to be displayed
#         level   : 'default' (grey), 'primary' (blue label/grey badge),
#                   'success' (green), 'info' (cyan), 'warning' (orange)
#                   or 'danger' (red)
#
#       InsertHTML(url)
#         This function is used to insert an HTML information inside
#         a page. (Ref Top3 example showing top most process cpu usage)
#
#  The statistic page is fully configurable.
#  It is possible to define multiple pages. Each page is identified by
#  its <page id>.
#
#  web.status.<page id>.name=<page name>
#    <page name> name of the page displayed into the drop down menu in
#    case of multiple pages.
#
#  The statistic page displays statistics graphs. The graphs are
#  identified an unique <statistic id> and by the following parameters.
#
#  web.statistics.<page id>.content.<statistic id>.name=<statistic name>
#    <statistic name> is the name of the statistics displayed in the
#    top left drop down list.
#
#  web.statistics.<page id>.content.<statistic id>.graph.<rrd id>=<data name>
#    <rrd id> is identifying the graph and is unique per <statistic id>
#    <data name> is the name of the dynamic and static extracted as
#    described in the KPI extraction section.
#
#  web.statistics.<page id>.content.<statistic id>.ds_graph_options.<data name>.label=<label>
#    <data name> same as the previous <data name>
#    <label> Label to display in legends. It is possible to setup other parameters
#    of ds_graph_options. Refer to the following web page for details:
#    http://javascriptrrd.sourceforge.net/docs/javascriptrrd_v0.5.0/doc/lib/rrdFlot_js.html
#
#  web.statistics.<page id>.content.<statistic id>.graph_options.<parameter>=<value>
#    <parameter> and <value> can be find into the same web page as previous
#    parameter. This allow to customize the graph and axis.
#
#  Example file are available in the template directory (prefixed by 'example').
#  To understand how a feature is behaving, you can include this example file
#  using the 'include' directive.
#  These include directive are already written (commented) into the default
#  configuration file: raspbian.conf
#  When configuration files change, it is required to restart rpimonitor.
#######################################################################

#web.friends.1.name=Raspberry Pi
#web.friends.1.link=http://192.168.0.123/
#web.friends.2.name=Shuttle
#web.friends.2.link=http://192.168.0.2/
#web.friends.3.name=Netbook
#web.friends.3.link=http://192.168.0.38/

web.page.icon='img/logo.png'
web.page.menutitle='RPi-Monitor  <sub>('+data.hostname+')</sub>'
web.page.pagetitle='RPi-Monitor ('+data.hostname+')'

web.status.1.name=Raspberry Pi
#web.status.2.name=Home
web.statistics.1.name=Raspberry Pi
#web.statistics.2.name=page 2

web.addons.1.name=Addons
web.addons.1.addons=about
#web.addons.1.name=Shellinabox
#web.addons.1.addons=shellinabox

#web.addons.2.name=Addons example
#web.addons.2.addons=example
#web.addons.2.showTitle=0

#web.addons.3.name=Webcam - Hawkeye
#web.addons.3.showTitle=0
#web.addons.3.addons=custom
#web.addons.3.url=http://0:8000/

#web.addons.4.name=Custom addons
#web.addons.4.addons=custom
#web.addons.4.showTitle=0
#web.addons.4.url=/addons/custom/custominfo.html

#web.addons.5.name=Top3
#web.addons.5.addons=top3

#include=/etc/rpimonitor/template/example.justgage.conf
#include=/etc/rpimonitor/template/example.badge_and_label.conf
#include=/etc/rpimonitor/template/example.progressbar.conf
#include=/etc/rpimonitor/template/example.visibility.conf

include=/etc/rpimonitor/template/version.conf
include=/etc/rpimonitor/template/uptime.conf
include=/etc/rpimonitor/template/cpu.conf
include=/etc/rpimonitor/template/temperature.conf
include=/etc/rpimonitor/template/memory.conf
include=/etc/rpimonitor/template/swap.conf
include=/etc/rpimonitor/template/sdcard.conf
include=/etc/rpimonitor/template/usb_hdd.conf
include=/etc/rpimonitor/template/network.conf

#include=/etc/rpimonitor/template/printer.conf
#include=/etc/rpimonitor/template/storage.conf
#include=/etc/rpimonitor/template/services.conf
#include=/etc/rpimonitor/template/wlan.conf
#include=/etc/rpimonitor/template/dht11.conf
Then copy the file /etc/rpimonitor/template/usb_hdd.conf:
########################################################################
# Extract USB HDD (sda1) information
# Page: 1
# Information Status Statistics
# - USBHDD1 total - yes - yes
# - USBHDD1 used - yes - yes
########################################################################
static.10.name=usbhdd_total
static.10.source=df -t ext4
static.10.regexp=sda1\s+(\d+)
static.10.postprocess=$1/1024
dynamic.14.name=usbhdd_used
dynamic.14.source=df -t ext4
dynamic.14.regexp=sda1\s+\d+\s+(\d+)
dynamic.14.postprocess=$1/1024
dynamic.14.rrd=GAUGE
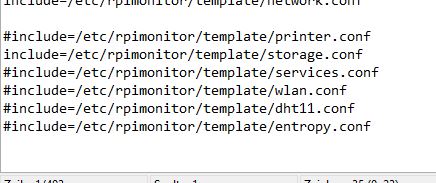
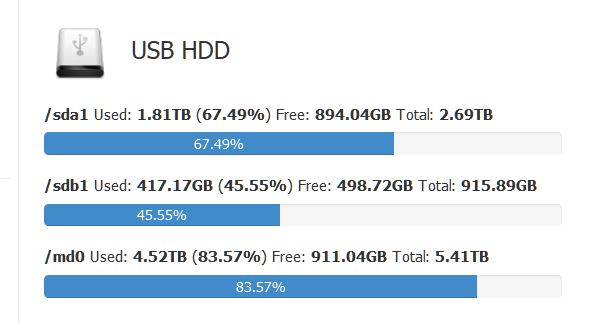
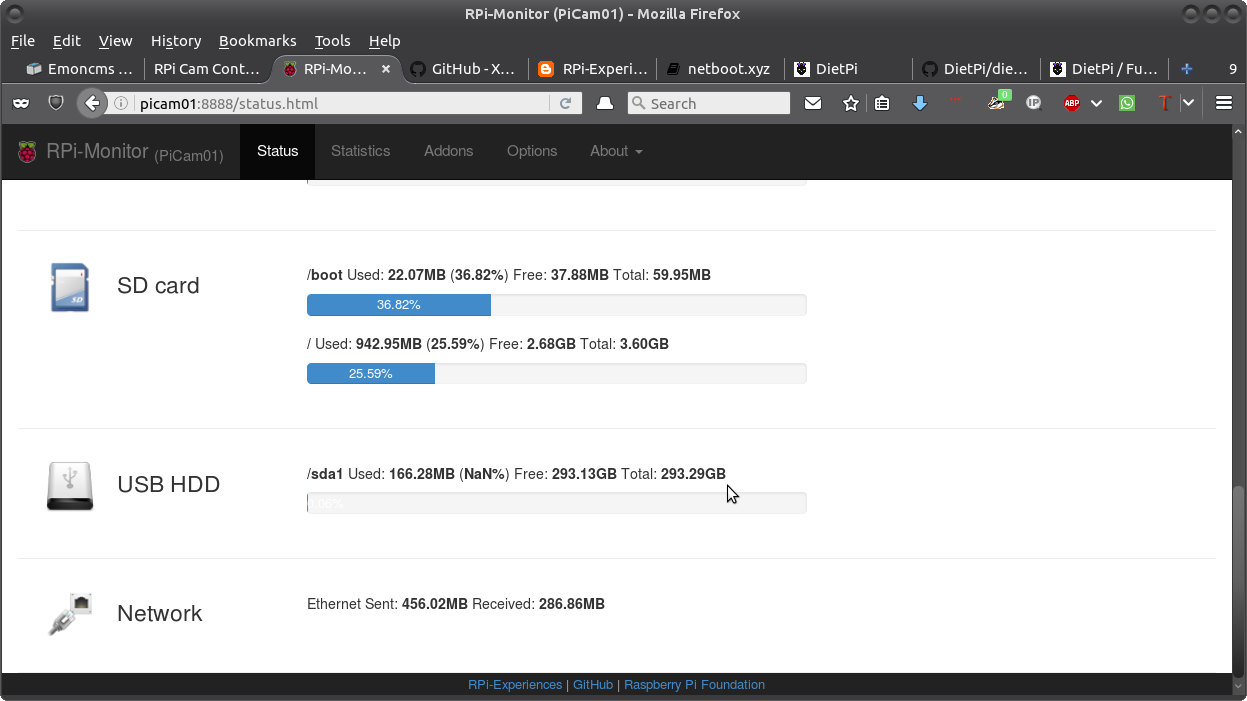
web.status.1.content.9.name=USB HDD
web.status.1.content.9.icon=usb_hdd.png
web.status.1.content.9.line.1="<b>/sda1</b> Used: <b>"+KMG(data.usbhdd_used,'M')+"</b> (<b>"+Percent(data.udbhdd_used,data.usbhdd_total,'M')+"</b>) Free: <b>"+KMG(data.usbhdd_total-data.usbhdd_used,'M')+ "</b> Total: <b>"+ KMG(data.usbhdd_total,'M') +"</b>"
web.status.1.content.9.line.2=ProgressBar(data.usbhdd_used,data.usbhdd_total)
web.statistics.1.content.9.name=USB HDD
web.statistics.1.content.9.graph.1=usbhdd_total
web.statistics.1.content.9.graph.2=usbhdd_used
web.statistics.1.content.9.ds_graph_options.usbhdd_total.label=USB HDD total space (MB)
web.statistics.1.content.9.ds_graph_options.usbhdd_total.color="#FF7777"
web.statistics.1.content.9.ds_graph_options.usbhdd_used.label=USB HDD used space (MB)
web.statistics.1.content.9.ds_graph_options.usbhdd_used.lines={ fill: true }
web.statistics.1.content.9.ds_graph_options.usbhdd_used.color="#7777FF"
Note: I simply used the storage.conf file as a template, so the content numbers (static.10, dynamic.14, etc.) might need changing, but as you can see from the screenshot, it all seems to work fine.
Thanks,
Rich.