Hi MichaIng and team,
I just noticed the load displayed is incorrect. even when Idle and viewing in htop the real load is only 2-5% but it shows as 1.16 and way above on my pi zero.
how to fix? is this a common issue?
best wishes!
Hi MichaIng and team,
I just noticed the load displayed is incorrect. even when Idle and viewing in htop the real load is only 2-5% but it shows as 1.16 and way above on my pi zero.
how to fix? is this a common issue?
best wishes!
This was the case on Bookworm already and should be visual only
Can I fix this by adding an offset or is it a bug on the OS level?
it was not constantly “red” on pihole in bookworm. now it is. even when idle.
As said should be visual only Load averages approach 1.0 after fresh install on RPi4 - #25 by MichaIng
It is a bug in Linux, but has been solved there already. So next kernel release from Raspberry Pi Ltd. will fix it: Raspberry Pi | Repeating "task vchiq-keep/0:39 blocked" kernel error · Issue #7610 · MichaIng/DietPi · GitHub
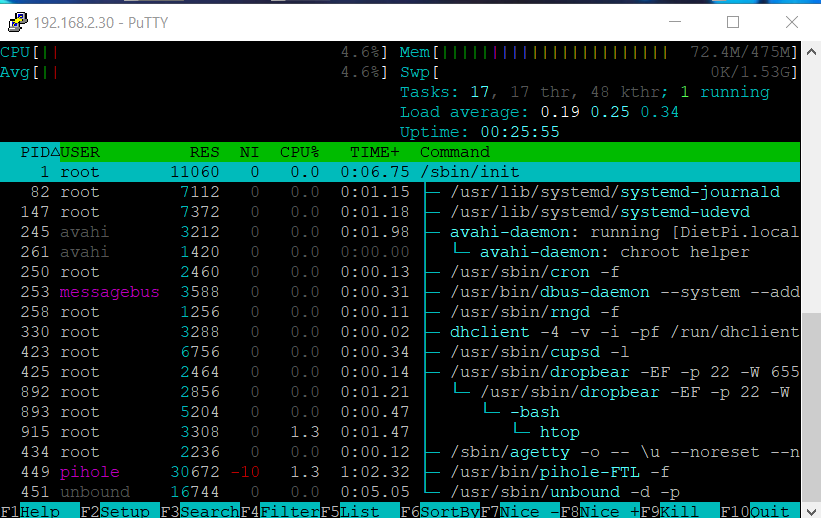
4.6% current usage, a minutely average of 19%, 5 minutes 25% and 15 minutes 34%, this looks like a normal cooldown from some heavier boot tasks, including DietPi update check and APT update, which can take a while on RPi 1/Zero. I guess is lowered further in the meantime? And I guess you see some peaks in between, which are difficult to see in the default 1.5s interval of htop.
The kernel bug produced a fixed +1.0 (+100%) CPU load. That is not visible for you anymore. You should also not see the kernel errors every some minutes in dmesg anymore, i.e. the workaround works.
Btw, rngd shouldn’t be required anymore on recent Linux versions. As long as you did not intentionally install it after facing some out-of-entropy situations, you can safely purge it:
apt autopurge rng-tools5
This needs to be provided by RPi developer, not something DietPi can fix.
The issue was introduced and later reverted (after the issue was reported) from an upstream Linux developer/contributor. As said, it is fixed already in Linux master and v6.12 branch. We just need to wait for RPi Ltd. to push another built to archive.raspberrypi.com. It is no serious bug, worst aspect an annoyance when working on local console due to the regular error message. So probably no reason for them to rush (if they are even aware of it).
I don’t think so. The bug adds a flat +1.0 to load averages. uptime and htop (at top right, “Load averages”) show the same as Pi-hole, right?
Where do you get these 3% from? Different tools obtain this differently, while load averages are reported by a kernel API (AFAIK), hence are more standardized. The problem with other tools, like also the htop CPU usage bars, is that they may miss spikes with the intervals they measure. So e.g. you might see 3% or similar, but miss some short 50% spikes in between. Load averages, as the same says, have those spikes averaged in.
And another note about this: Load averages are about a single CPU core only. So if the system has 4 cores, 1.0 or 100% mean only one core is loaded, or all cores by 25% each.