Temperature spikes after installing latest Dietpi v10.6.2

Creating a bug report/issue

I have searched the existing open and closed issues

Required Information

  • DietPi version | G_DIETPI_VERSION_CORE=10
    G_DIETPI_VERSION_SUB=6
    G_DIETPI_VERSION_RC=2
    G_GITBRANCH=‘master’
    G_GITOWNER=‘MichaIng’
  • Distro version | trixie
  • Kernel version | Linux RockPi 6.18.37-current-rockchip64 #1 SMP PREEMPT Sat Jun 27 10:06:50 UTC 2026 aarch64 GNU/Linux
  • Architecture | arm64
  • SBC model | ROCK 4 (aarch64)
  • Power supply used | Manufacturer default
  • SD card used | Lexar

Additional Information (if applicable)

  • I was previously running Dietpi v10.5 without the problem

Expected behaviour

  • No unexplainable temperature spikes.

Actual behaviour
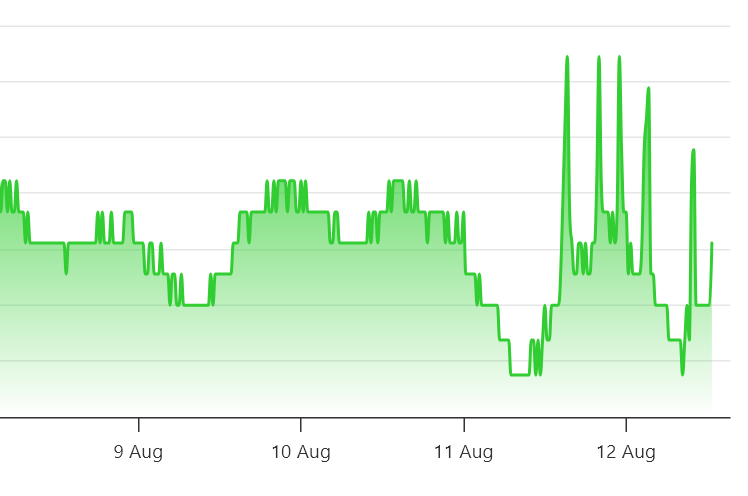
  • After installing the update at 3:20pm local time, I’m seeing spikes at:
    • 8pm
    • 11pm
    • 3am (next day)
    • 10am
    • 1pm (now)

Extra details

  • I try to check journalctl at those times, but there is nothing of interest at those times.
  • My script which I run via cron every 20 minutes is below
#!/bin/bash
output_file="/mnt/dietpi_userdata/caddy/tempmonitor/data/cpu_temp.csv"

# write header
if [ ! -f "$output_file" ]; then
    echo "Date,Temperature" > "$output_file"
fi

# Path to the hwmon0 temperature input file
HWMON0_TEMP_FILE="/sys/class/hwmon/hwmon0/temp1_input"
TEMP_CELSIUS='0'

# Check if the file exists
if [ -f "$HWMON0_TEMP_FILE" ]; then
    # Read the temperature value in millidegrees Celsius
    TEMP_MILLICELSIUS=$(cat "$HWMON0_TEMP_FILE")
        
    # Convert to degrees Celsius using awk for floating-point division
    TEMP_CELSIUS=$(awk "BEGIN {printf \"%.3f\", $TEMP_MILLICELSIUS / 1000}")
else
    # echo "Error: Temperature file not found."
        TEMP_CELSIUS='N/A'
fi

# write temp
timestamp=$(date +"%Y-%m-%d %H:%M:%S")
echo "$timestamp,$TEMP_CELSIUS" >> "$output_file"

Do you use some sort of active cooling? Is it possible that the cooling does not work anymore?

Interesting is, that the base temperature seems lower. What is the scale of these horizontal lines?

As you measure only once very 20 minutes, keep in mind that the actual interval of these peaks could be higher, and you just catch every X of them, as the others appear and are cooled down within two data points. But to evaluate that, the scale and cooling method are relevant.

Cron jobs and systemd timers appear in journalctl, when process internal scheduled jobs not. Hence also take a look at software services, whether they trigger some regular scan or backup or such.

Possible that the last kernel upgrade includes some changed thermal trip points, or other changes that may be relevant. Do you remember whether the DietPi update included a kernel upgrade, i.e. whether it prompted for a reboot afterwards?

No, passive cooling using heatsink case.

Each horizontal line represents 1 degrees C. I do agree the 20 minute interval doesn’t capture the true extent of the spikes, but I’ve been running this monitoring script for many years on DietPi and this is the first time I’ve seen this behaviour.

Anyway, I think I found the culprit. Doing a htop, I’m seeing Uptime Kuma seemingly consuming a lot of CPU. I only have three monitors, checking at 15 minute intervals, but I’m seeing CPU spikes every 5 seconds. Is that normal? I have restarted the Uptime Kuma service and it’s looking better. It’s still using more CPU than I thought it would have needed, given my 15 minute checks.

Lastly, there was no prompt for a reboot after the update. Though I remember doing a kernel upgrade and reboot a few weeks ago.

Okay, so its roughly 3 °C peaks. This can be indeed from very short (few seconds) CPU usage spikes. A heatsink attached with those common pads to the SoC flattens longer and larger temperature increases.

Hmm, I have no Uptime Kuma instance in production to know about its CPU usage pattern. Could setup a test instance, but that is probably not the same. How many CPU usage % are these spikes? And does the CPU frequency go up? You can enable it in htop > “F2 Setup” > “Also show CPU frequency”. If he CPU frequency remains at minimum, the CPU usage spikes can give a false impression, since 50% at 400 MHz is much lower than 50% at 1800 MHz. In case of RK3399 big.LITTLE, also the smaller cores might ramp up only, which produce less heat than the larger cores.

What would be also confusing, is that Uptime Kuma is not affected by any APT package that could have been upgraded along with the DietPi update. And the DietPi update almost never updates installed software titles. For Uptime Kuma, this happens only with a reinstall. If you didn’t do that in a while, actually worth to see whether it has a positive effect:

dietpi-software reinstall 176

Maybe it fixes a bug that has an effect on idle CPU usage (when no actual URL probe is done).

If you did the kernel upgrade earlier, then we know it is unrelated.

The change in the temperature graph is significant, but given that it can be rather short CPU/temperature spikes, with a rather long measurement interval, it is also possible that the true temperature profile did not change, but just the shift between the usage spikes and the measurements, so that they capture the temperature spikes regularly near their peak, while those peaks were mostly missed before. A dietpi-update stops and restarts services, hence any service-internal schedule can be shifted relative to the fixed cron job times.

To get a better idea, you could stop Uptime Kuma for a longer while, to check whether this eliminates the temperature spikes entirely. And you could let the temperature script run every minute, to get a refined temperature profile, that is unlikely to miss any increase by >=3 °C.

So yesterday’s restart of Uptime Kuma did fix the problem, but I think you are right - it could all be coincidence with timings due to the measurement interval.

I think Uptime Kuma’s idle CPU is too high for what it’s doing, so I’ve taken your suggestion to do a reinstall.

I’ll monitor and see if I need to go the extra step and record the temperature every minute.

So the reinstall didn’t make a difference.

I also tried with all the monitors paused and it still consumed CPU when it should be idle.

So I think the underlying implementation in Uptime Kuma is quite poor/inefficient. I’ve seen various accounts online of similar CPU usage problems, so I’m closing this thread as it’s clearly a Uptime Kuma problem.