[Solved] Raspberry Pi 3B running ST7735 display

Hi,

I’m trying to make a ST7735 display work on a Raspberry Pi 3B as a system stats display.

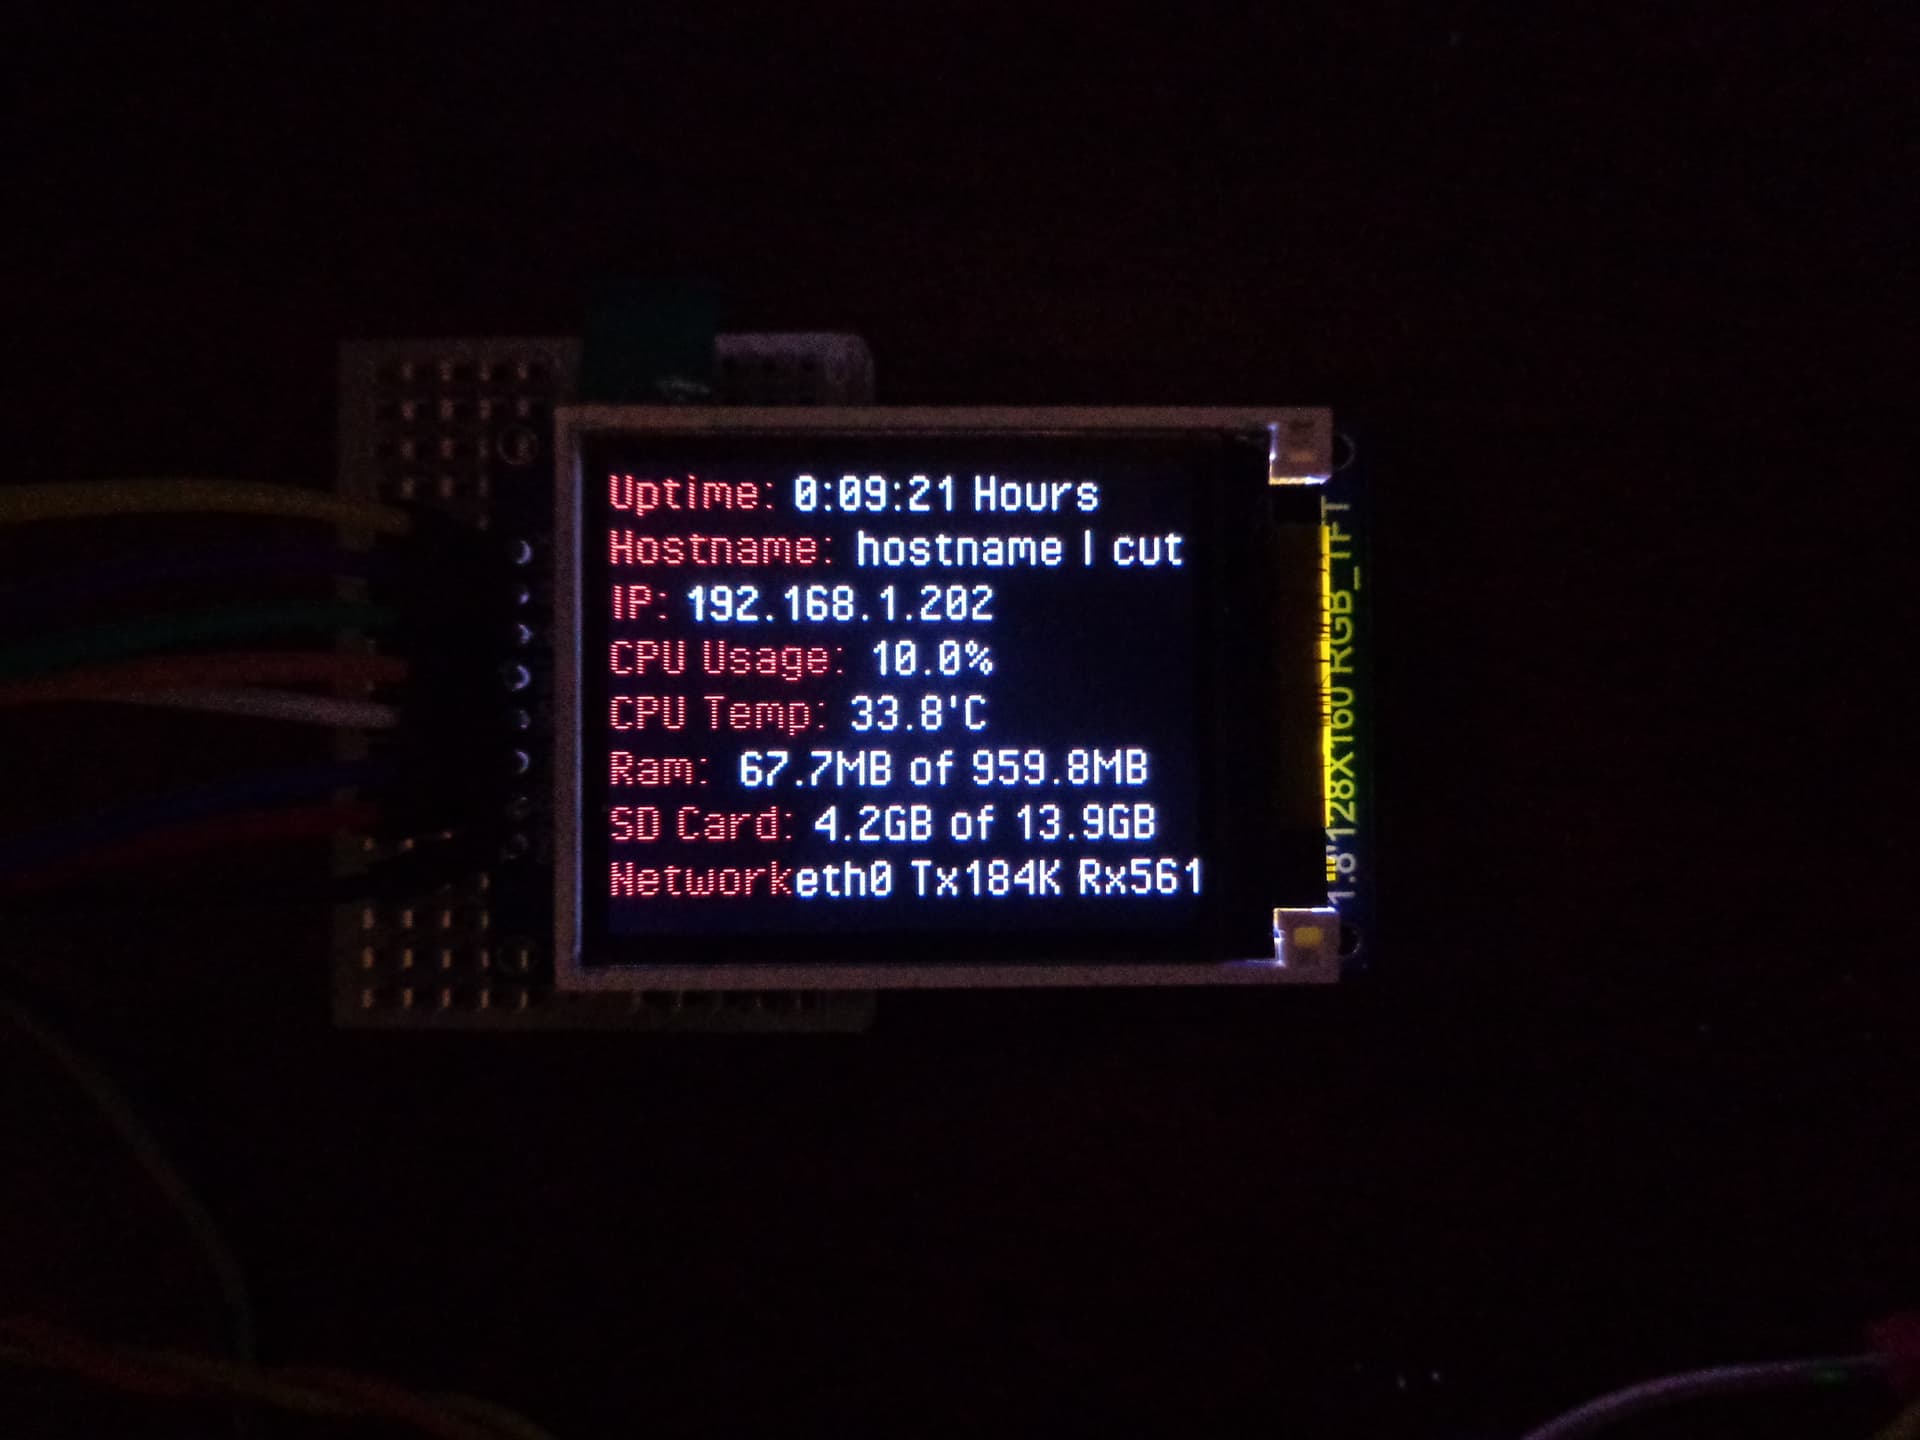
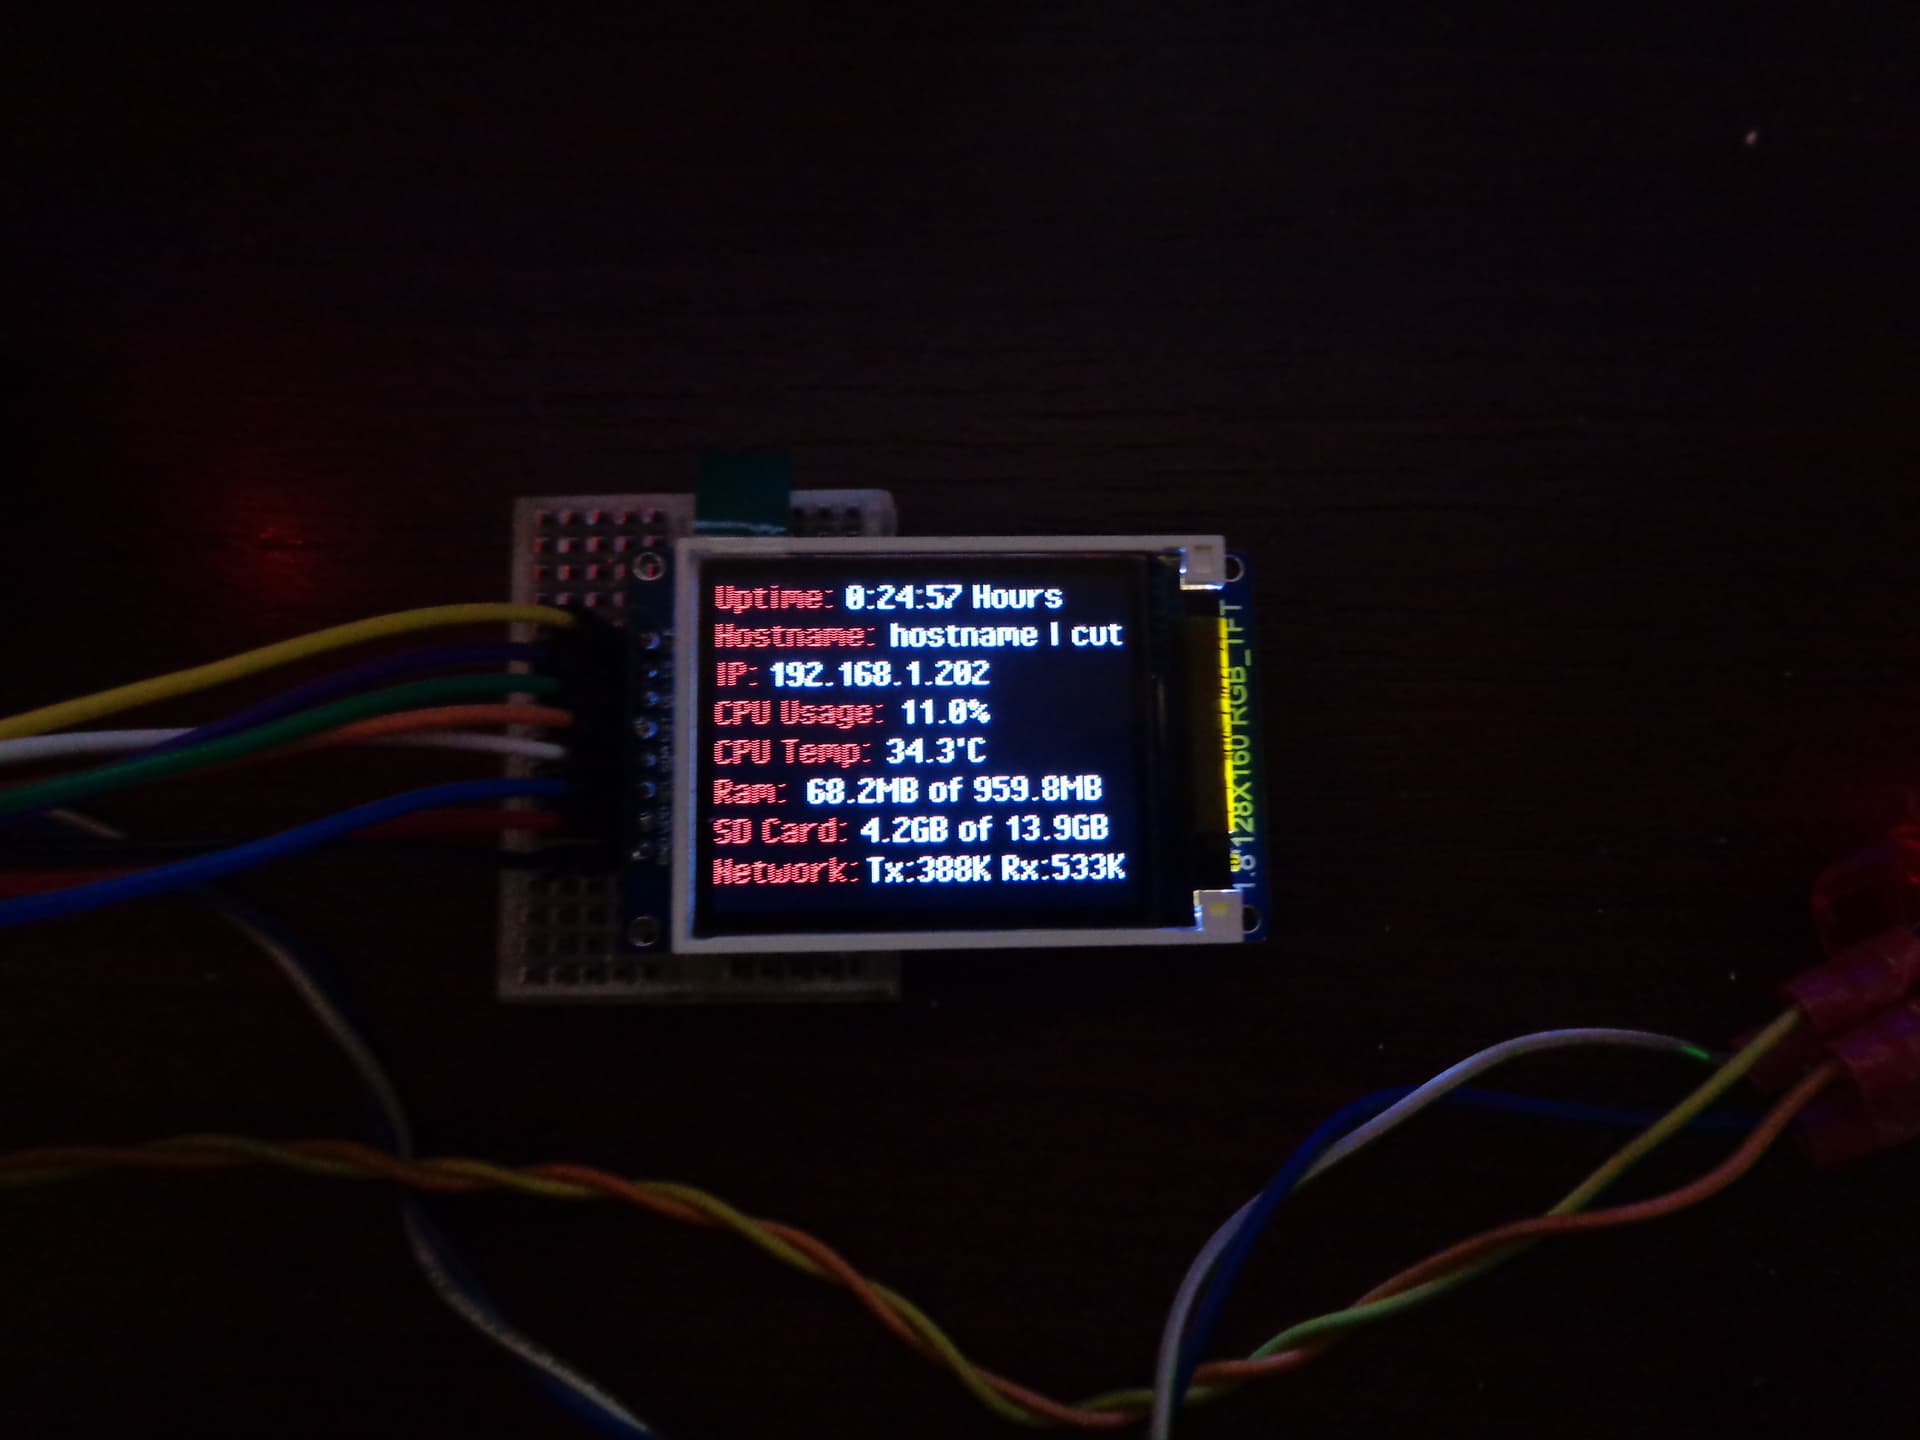
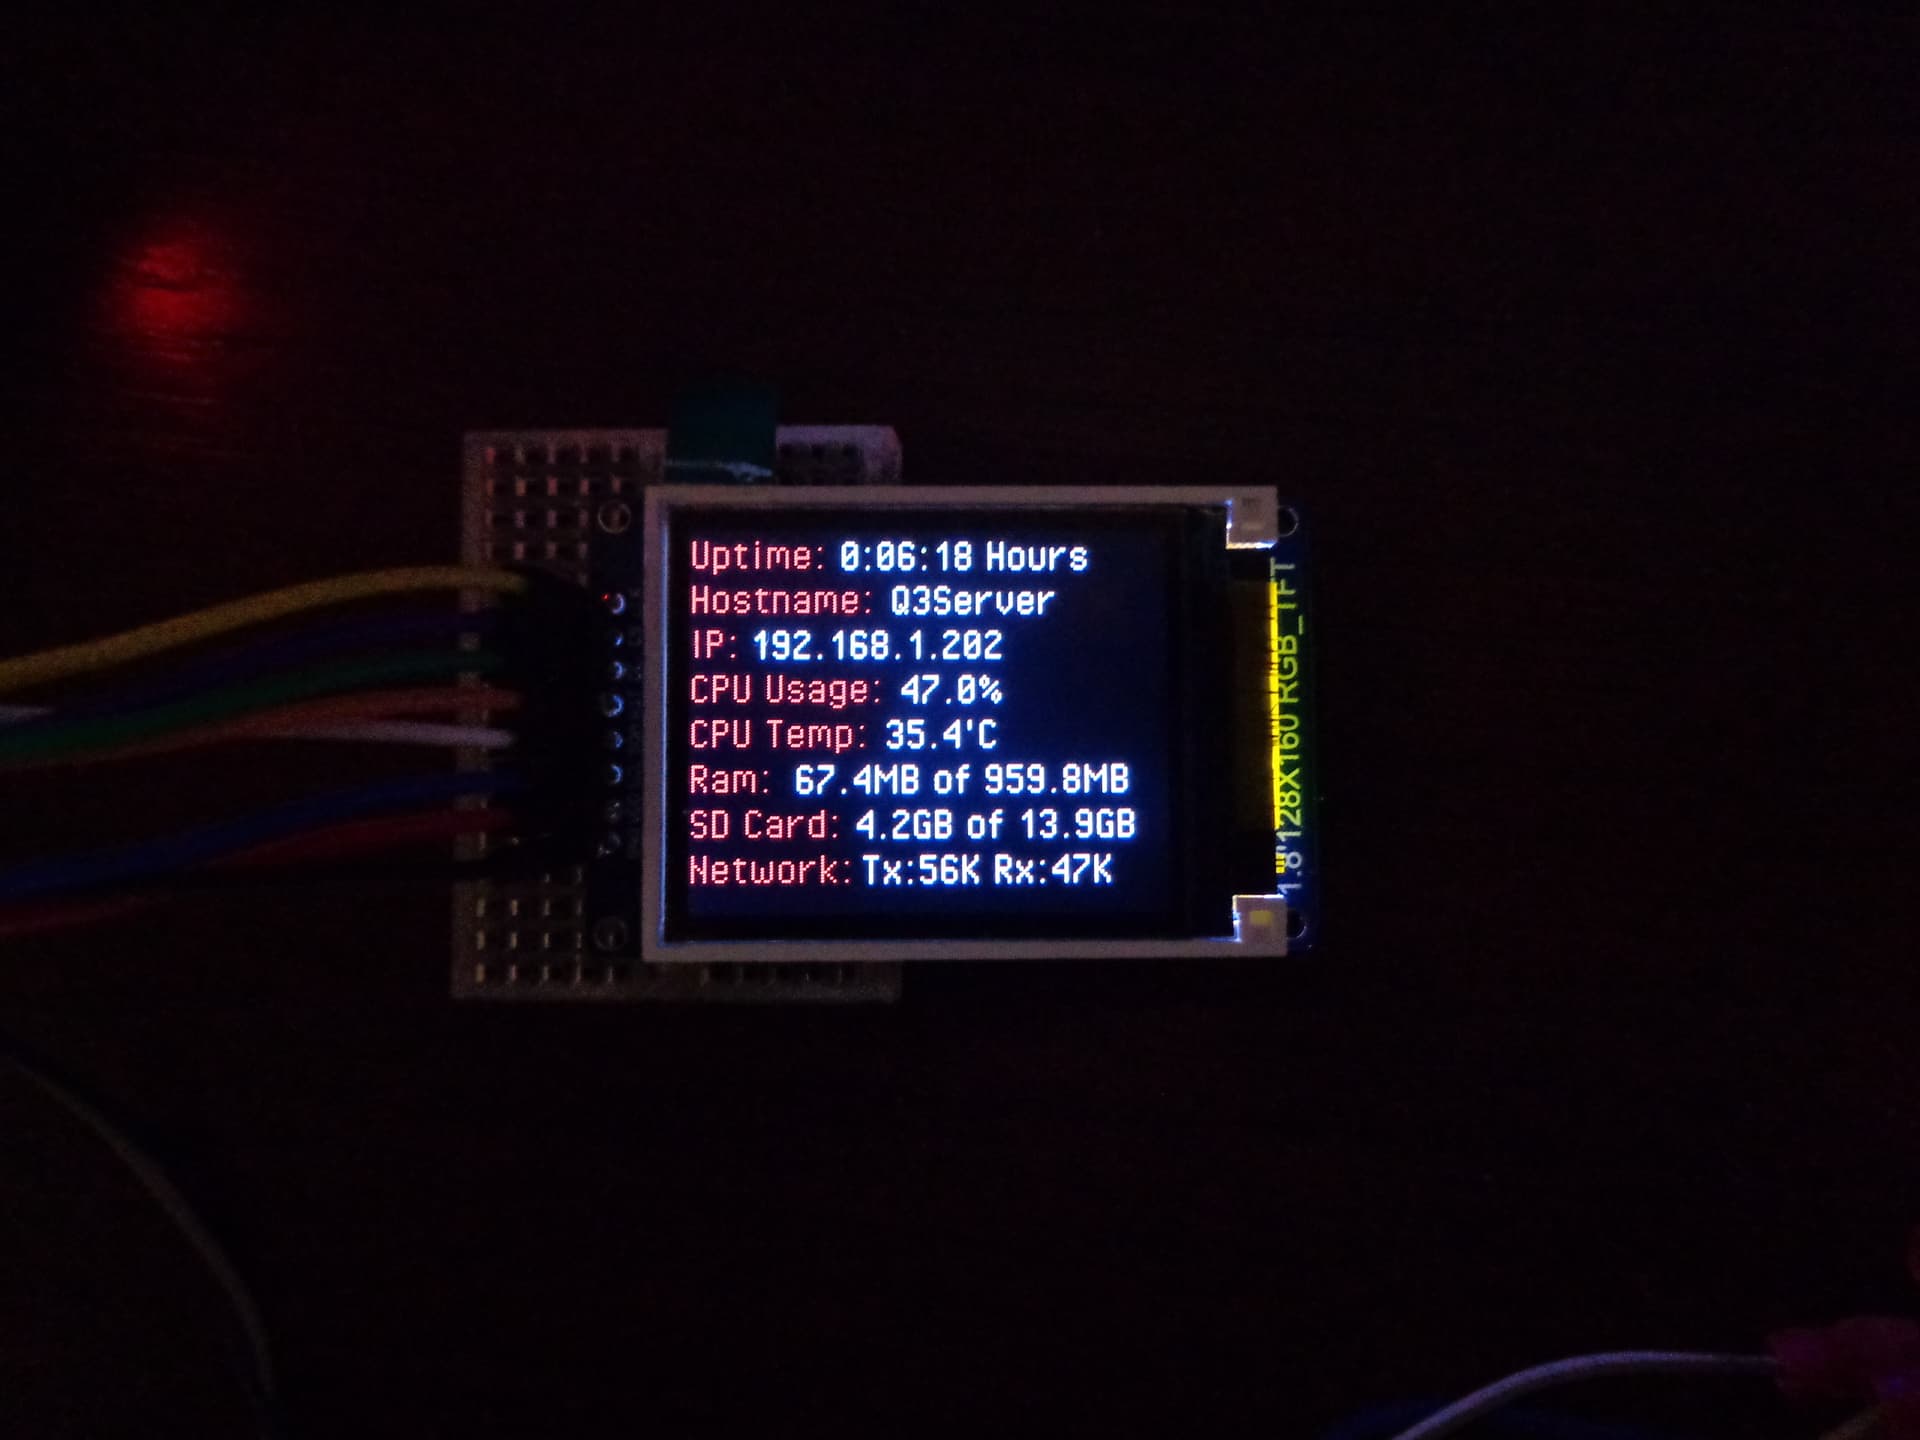
It was not easy to make it work, but now I’m having some problems trying to display some system stats like the CPU Usage in %, the CPU Temperature and the network Tx and Rx values.

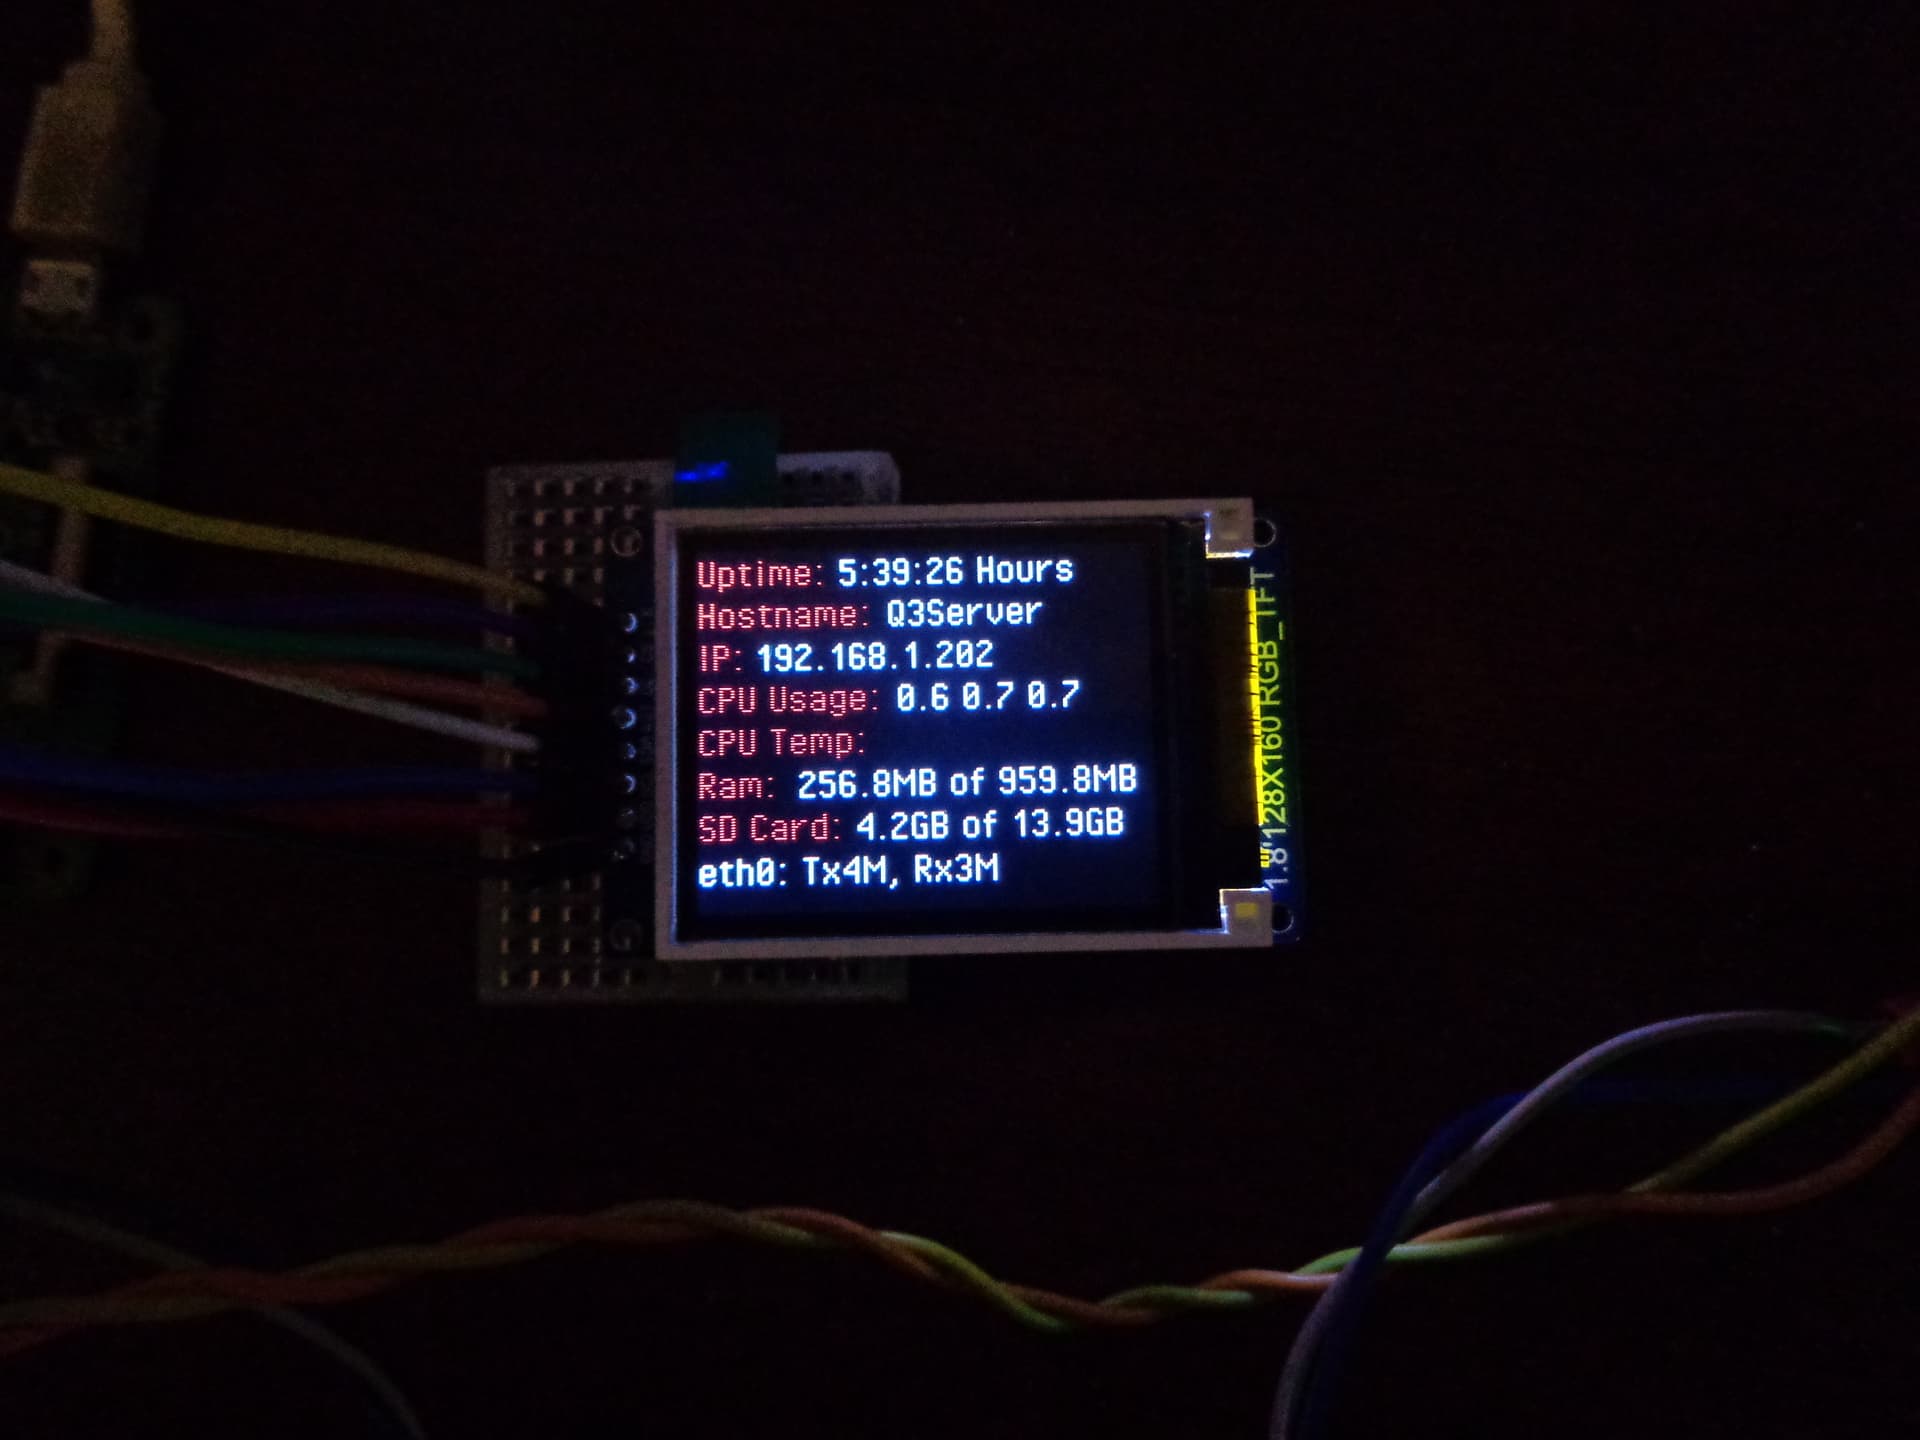
Here is a photo of what it displays at the moment:

And here is my stats.py file:

import socket
import fcntl
import struct
import os
import sys
import time
import psutil
from PIL import ImageDraw
from PIL import Image
from PIL import ImageFont
from pathlib import Path
from datetime import datetime
from demo_opts import get_device
from luma.core.render import canvas

if os.name != 'posix':
    sys.exit('{} platform not supported'.format(os.name))

try:
    import psutil
except ImportError:
    print("The psutil library was not found. Run 'sudo -H pip install psutil' to install it.")
    sys.exit()

def bytes2human(n):
    """
    >>> bytes2human(10000)
    '9K'
    >>> bytes2human(100001221)
    '95M'
    """
    symbols = ('K', 'M', 'G', 'T', 'P', 'E', 'Z', 'Y')
    prefix = {}
    for i, s in enumerate(symbols):
        prefix[s] = 1 << (i + 1) * 10
    for s in reversed(symbols):
        if n >= prefix[s]:
            value = int(float(n) / prefix[s])
            return '%s%s' % (value, s)
    return f"{n}B"

# check uptime
def up_time():
    uptime = datetime.now() - datetime.fromtimestamp(psutil.boot_time())
    return str(uptime).split('.')[0] + ' Hours'
    
# Examples for usage:
#    IP = get_ipv4_from_interface("eth0")
#    IP = get_ipv4_from_interface("wlan0")
def get_ipv4_from_interface(interfacename):
    res="IP ?"
    try:
        iface=psutil.net_if_addrs()[interfacename]
        for addr in iface:
            if addr.family is socket.AddressFamily.AF_INET:
                return "{0}".format(addr.address)
    except:
        return res
    return res

# This looks for the first IPv4 address that is not on the
# loopback interface. There is no guarantee on the order of
# the interfaces in the enumeration. If you've multiple interfaces
# and want to ensure to get an IPv4 address from a dedicated adapter,
# use the previous method.
def get_ipv4():
    ifaces=psutil.net_if_addrs()
    for key in ifaces:
        if (key!="lo"): # Ignore the loopback interface
            # if it's not loopback, we look for the first IPv4 address    
            iface = ifaces[key]
            for addr in iface:
                if addr.family is socket.AddressFamily.AF_INET:
                    return "{0}".format(addr.address)
    return "IP ?"

# check the cpu usage
def cpu_usage():
    av1, av2, av3 = os.getloadavg()
    return "%.1f %.1f %.1f" % (av1, av2, av3)

# check the cpu temp
def cpu_temp():
        temperature = ''
        os.system("rm -rf temp_data")
        os.system("/opt/vc/bin/vcgencmd measure_temp > temp_data")
        temp_file = open("temp_data","r")
        for line in temp_file:
                line = line.rstrip()
                temperature = line.split('=')[1]
        temp_file.close()
        os.system("rm -rf temp_data")
        return temperature

# check the ram usage
def ram_usage():
    memory = psutil.virtual_memory()
    # Divide from Bytes -> KB -> MB
    ramused = round(memory.used/1024.0/1024.0,1)
    ramtotal = round(memory.total/1024.0/1024.0,1)
    return str(ramused) + 'MB of ' + str(ramtotal)+'MB'

# check disk usage
def disk_usage():
    disk = psutil.disk_usage('/')
    # Divide from Bytes -> KB -> MB -> GB
    diskused = round(disk.used/1024.0/1024.0/1024.0,1)
    disktotal = round(disk.total/1024.0/1024.0/1024.0,1)
    return str(diskused) + 'GB of ' + str(disktotal)+'GB'

# check network
def network(iface):
    stat = psutil.net_io_counters(pernic=True)[iface]
    return "%s: Tx%s, Rx%s" % (iface, bytes2human(stat.bytes_sent), bytes2human(stat.bytes_recv))
    
# print everything
def stats(device):
    device.show()
    
    # use custom font
    font_path = os.path.abspath(os.path.join(os.path.dirname(__file__), 'fonts', 'PixelOperator.ttf'))
    font2 = ImageFont.truetype(font_path, 16)

    #IP = get_ipv4()
    IP = get_ipv4_from_interface("eth0") # Alternative

    with canvas(device) as draw:
        draw.text((0,0), "Uptime: ", font=font2, fill="red")
        draw.text((50,0), up_time(), font=font2, fill="white")
        draw.text((0,15), "Hostname: ", font=font2, fill="red")
        draw.text((67,15), "Q3Server", font=font2, fill="white")
        draw.text((0,30), "IP: ", font=font2, fill="red")
        draw.text((20,30), IP, font=font2, fill="white")
        draw.text((0,45), "CPU Usage: ", font=font2, fill="red")
        draw.text((70,45), cpu_usage(), font=font2, fill="white")
        draw.text((0,60), "CPU Temp: ", font=font2, fill="red")
        draw.text((53,60), cpu_temp(), font=font2, fill="white")
        draw.text((0,75), "Ram: ", font=font2, fill="red")
        draw.text((35,75), ram_usage(), font=font2, fill="white")
        draw.text((0,90), "SD Card: ", font=font2, fill="red")
        draw.text((55,90), disk_usage(), font=font2, fill="white")
        #draw.text((0, 105), "Network: ", font=font2, fill="red")
        draw.text((0, 105), network('eth0'), font=font2, fill="white")

def main():
    while True:
        stats(device)
        time.sleep(1)

if __name__ == "__main__":
    try:
        device = get_device()
        device.clear()
        main()
    except KeyboardInterrupt:
        pass

Can someone please help me make the CPU Usage work in % value and not the Loads and the CPU Temperature to display and the network interface name and Tx and Rx values show properly?

Thanks.

For the CPU usage

return f"{av1 * 100}% {av2 * 100}% {av3 * 100}%"

Should do it.

Did you test the commands on console? vcgencmd should have a different location (which vcgencmd) since Bullseye and the command in your script should hence fail as well on console, telling you why.

Thanks.

I’m trying your suggestion, but now the CPU Usage shows values like “190% 133%”.
I only need 1 value of the total CPU Usage.

And I fixed the location of vcgencmd to “os.system(”/usr/bin/vcgencmd measure_temp > temp_data")".
But still does not show the CPU Temperature value.
While running the stats.py the console shows “VCHI initialization failed”.
(Edit) Tried to run the stats.py with sudo and now the CPU Temperature shows up.

Then use av1 only (last 1 minute average)?
Else os.getloadavg isn’t the right module for you. It shows 3 values, average of last 1, 5 and 15 minutes with “1” being one core fully loaded.

Are you running the script as root?

Thanks.

Tried to run the stats.py with sudo and now the CPU Temperature shows up.

Is there a way to show the total CPU Usage of the 4 cores combined into 1 single % value?
(Edit) With:

# check the cpu usage
def cpu_usage():
    av1, av2, av3 = os.getloadavg()
    return f"{av1 * 100}%"

Now it seems to show the CPU Usage % properly, however seems a bit high % at around 40% while running nothing else.

Still need to fix the network interface name and Tx and Rx values.
Can someone help?

And I also need to make the hostname display from command instead of static.

# check hostname
def host_name():
    hostname = "hostname | cut -d\' \' -f1 | awk '{printf \"Host: %s\", $0}'"
    return str(hostname)

With this lines it isn’t showing properly.
Can someone help?

Three aspects about the CPU usage:

  1. It’s still 100% per core, i.e. 40% means 10% overall load.
  2. Since the CPU clock changes dynamically depending on load, it could theoretically mean 10% at 600 MHz, i.e. much less of its full potential.
  3. The script itself, running not only internal methods but also external commands, can cause quite a major part of this load.

What do you want to change on network output? 3 MiB RX and 4 MiB TX looks correct. I’d add some space after “x” but otherwise?

Hostname could be read as well from /etc/hostname. But isn’t there a native Python method in os or so? I’d reduce calling external commands to a minimum.

Thanks.

I’m not being able to remove the “eth0” from the script, when I do the script stops launching and dumps the following error into console:

Traceback (most recent call last):
  File "/home/quake3/LCD-Stats/examples/test3.py", line 161, in <module>
    main()
  File "/home/quake3/LCD-Stats/examples/test3.py", line 154, in main
    stats(device)
  File "/home/quake3/LCD-Stats/examples/test3.py", line 150, in stats
    draw.text((50, 105), network('eth0'), font=font2, fill="white")
  File "/home/quake3/LCD-Stats/examples/test3.py", line 120, in network
    return "Tx%s Rx%s" % (iface, bytes2human(stat.bytes_sent), bytes2human(stat.bytes_recv))
TypeError: not all arguments converted during string formatting

With the following lines it works fine except it shows the “eth0” text on it:

# check network
def network(iface):
    stat = psutil.net_io_counters(pernic=True)[iface]
    return "%s Tx%s Rx%s" % (iface, bytes2human(stat.bytes_sent), bytes2human(stat.bytes_recv))

And this are the lines that give that error in the console:

# check network
def network(iface):
    stat = psutil.net_io_counters(pernic=True)[iface]
    return "Tx%s Rx%s" % (iface, bytes2human(stat.bytes_sent), bytes2human(stat.bytes_recv))

I only removed the “%s” in the return line.

I also tried to remove the “‘eth0’” on the line:

draw.text((50, 105), network(), font=font2, fill="white")

But it gives the following error:

Traceback (most recent call last):
  File "/home/quake3/LCD-Stats/examples/test4.py", line 162, in <module>
    main()
  File "/home/quake3/LCD-Stats/examples/test4.py", line 155, in main
    stats(device)
  File "/home/quake3/LCD-Stats/examples/test4.py", line 151, in stats
    draw.text((50, 105), network(), font=font2, fill="white")
TypeError: network() missing 1 required positional argument: 'iface'

And the Hostname I’m not being able to make it display from command, it works fine by drawing the text, but I want it able to show from command.
I tried a lot of things like:

# check hostname
def host_name():
    hostname = "hostname | cut -d\' \' -f1 | awk '{printf \"Host: %s\", $0}'"
    return str(hostname)

And also:

# check hostname
def host_name():
    hostname = "hostname -I | cut -d' ' -f1"
    return str(hostname)

Before I use this ST7735 displays, I used some SH1106 OLED ones and was able to make both the Network and the Hostname show up properly, and tried to copy paste and even adjust the lines of that OLED script but it isn’t working with this new ST7735 script.

# check network
def network(iface):
    stat = psutil.net_io_counters(pernic=True)[iface]
    return "%s Tx%s Rx%s" % (iface, bytes2human(stat.bytes_sent), bytes2human(stat.bytes_recv))

I’m not familiar with python but it looks like its returning 3 values which are saved in 3 arguments/variable or whatever it is called :smiley:
So when you delete the %s you have also to delete the iface, I think.

 return "Tx%s Rx%s" % (bytes2human(stat.bytes_sent), bytes2human(stat.bytes_recv))
1 Like

Thanks.

Your suggestion works!

Now only missing to fix the Hostname.

Can you or someone else help?

If I try hostname -I | cut -d' ' -f1 from CLI it just shows my LAN IP.
If I try @MichaIng suggestion cat /etc/hostname I get my hostname.
But these are all bash commands. As you can see, if you use this inside your python script it just prints these commands as text. We actually need to use python. I had a quick web search and came up with:

import socket
print(socket.gethostname())

The socket module is already imported in your stats.py. And instead of creating our own function def_hostname() you can just use socket.gethostname().
But I’m not sure how to code this, since I’m not a programmer (yet :smiley: )
Can you show the whole script test4.py?

Maybe you could do this (I’m not sure), but I’m sure there is an more efficient way:

# check hostname
def host_name():
    hostname = socket.gethostname()
    return str(hostname)
1 Like

Thanks.

Your suggestion works.

Here is my current 100% working script, I removed the not needed stuff and rearranged the lines.

import socket
import fcntl
import struct
import os
import sys
import time
import psutil
from PIL import ImageDraw
from PIL import Image
from PIL import ImageFont
from pathlib import Path
from datetime import datetime
from demo_opts import get_device
from luma.core.render import canvas

if os.name != 'posix':
    sys.exit('{} platform not supported'.format(os.name))

try:
    import psutil
except ImportError:
    print("The psutil library was not found. Run 'sudo -H pip install psutil' to install it.")
    sys.exit()

def bytes2human(n):
    """
    >>> bytes2human(10000)
    '9K'
    >>> bytes2human(100001221)
    '95M'
    """
    symbols = ('K', 'M', 'G', 'T', 'P', 'E', 'Z', 'Y')
    prefix = {}
    for i, s in enumerate(symbols):
        prefix[s] = 1 << (i + 1) * 10
    for s in reversed(symbols):
        if n >= prefix[s]:
            value = int(float(n) / prefix[s])
            return '%s%s' % (value, s)
    return f"{n}B"

# check uptime
def up_time():
    uptime = datetime.now() - datetime.fromtimestamp(psutil.boot_time())
    return str(uptime).split('.')[0] + ' Hours'

# check hostname
def host_name():
    hostname = socket.gethostname()
    return str(hostname)

# check ip
def get_ipv4_from_interface(interfacename):
    res="IP ?"
    try:
        iface=psutil.net_if_addrs()[interfacename]
        for addr in iface:
            if addr.family is socket.AddressFamily.AF_INET:
                return "{0}".format(addr.address)
    except:
        return res
    return res

# Examples for usage:
#    IP = get_ipv4_from_interface("eth0")
#    IP = get_ipv4_from_interface("wlan0")
IP = get_ipv4_from_interface("eth0")

# check the cpu usage
def cpu_usage():
    av1, av2, av3 = os.getloadavg()
    return f"{av1 * 100}%"

# check the cpu temp
def cpu_temp():
        temperature = ''
        os.system("rm -rf temp_data")
        os.system("/usr/bin/vcgencmd measure_temp > temp_data")
        temp_file = open("temp_data","r")
        for line in temp_file:
                line = line.rstrip()
                temperature = line.split('=')[1]
        temp_file.close()
        os.system("rm -rf temp_data")
        return temperature

# check the ram usage
def ram_usage():
    memory = psutil.virtual_memory()
    # Divide from Bytes -> KB -> MB
    ramused = round(memory.used/1024.0/1024.0,1)
    ramtotal = round(memory.total/1024.0/1024.0,1)
    return str(ramused) + 'MB of ' + str(ramtotal)+'MB'

# check disk usage
def disk_usage():
    disk = psutil.disk_usage('/')
    # Divide from Bytes -> KB -> MB -> GB
    diskused = round(disk.used/1024.0/1024.0/1024.0,1)
    disktotal = round(disk.total/1024.0/1024.0/1024.0,1)
    return str(diskused) + 'GB of ' + str(disktotal)+'GB'

# check network
def network(iface):
    stat = psutil.net_io_counters(pernic=True)[iface]
    return "Tx:%s Rx:%s" % (bytes2human(stat.bytes_sent), bytes2human(stat.bytes_recv))

# print everything
def stats(device):
    device.show()
    
    # use custom font
    font_path = os.path.abspath(os.path.join(os.path.dirname(__file__), 'fonts', 'PixelOperator.ttf'))
    font2 = ImageFont.truetype(font_path, 16)

    with canvas(device) as draw:
        draw.text((0,0), "Uptime: ", font=font2, fill="red")
        draw.text((50,0), up_time(), font=font2, fill="white")
        draw.text((0,15), "Hostname: ", font=font2, fill="red")
        draw.text((67,15), host_name(), font=font2, fill="white")
        draw.text((0,30), "IP: ", font=font2, fill="red")
        draw.text((20,30), IP, font=font2, fill="white")
        draw.text((0,45), "CPU Usage: ", font=font2, fill="red")
        draw.text((70,45), cpu_usage(), font=font2, fill="white")
        draw.text((0,60), "CPU Temp: ", font=font2, fill="red")
        draw.text((65,60), cpu_temp(), font=font2, fill="white")
        draw.text((0,75), "Ram: ", font=font2, fill="red")
        draw.text((35,75), ram_usage(), font=font2, fill="white")
        draw.text((0,90), "SD Card: ", font=font2, fill="red")
        draw.text((55,90), disk_usage(), font=font2, fill="white")
        draw.text((0, 105), "Network: ", font=font2, fill="red")
        draw.text((57, 105), network('eth0'), font=font2, fill="white")

def main():
    while True:
        stats(device)
        time.sleep(1)

if __name__ == "__main__":
    try:
        device = get_device()
        device.clear()
        main()
    except KeyboardInterrupt:
        pass

I hope this script is useful for someone else too.

Thanks to all the people who helped me making this work.

2 Likes

Great, and yes, using some native Python function to get system info is definitely the better option compared to running external/shell commands. For CPU temperature on RPi, however, vcgencmd is likely more reliably then some generic Python module. The RPi provides CPU temps as well via sysfs at /sys/class/thermal/thermal_zone0/temp, but every SBC and also every x86 motherboards writes it to a different path and sysfs class, so that generic CPU temp libraries are often wrong. I.e. your solution looks like best you can do IMO.

@AgentX

Thank you so much for showing this. It is exactly what i wanted to do but it wont run for me.

I have an error pop up and I was wondering ifnyou could help me please?

Thanks
Eifion

Hi,

I followed the following tutorial and it works fine:
https://luma-lcd.readthedocs.io/en/latest/install.html

And used this examples as a base:
https://github.com/rm-hull/luma.examples

I hope it helps.

@AgentX

Brilliant Thanks.

I have an error coming up;
modulenotfounderror: no module named ‘demo_opts’
It’s line 13

Any ideas will be gratefully received.

Thanks again
Eifion

You have to install this module into your python environment with pip.

https://docs.python.org/3/installing/index.html

Thanks for the reply. Can you explain it in novice terms please? :rofl:

I am only just starting out with the Pi. I have tried following and installing python -m pip install SomePackage, but still the same.

I must be doing something wrong

Thanks
Eifion

Did you get any response to the python -m pip install _some_package_ ?
And can you show the output of python -V pls.

EDIT: (source)

Looks like the package is not available via pip, but you can find it here:
https://github.com/rm-hull/luma.examples/blob/a1ec777f866e81105501a49658fa0e35e2d20da9/examples/demo_opts.py
Maybe @AgentX can give you further assistance.

Hi,

Are you trying to run any of the examples of the last link?

Or just the stats.py script that I posted?

If you’re trying to run just the stats.py, try moving it to inside the examples folder and run it again.