The foundations of this guide are basically the official RPi-Monitor docs and another tutorial about adding services to RPi-Monitor. Unfortunately I didn’t save the link to it, but it was also a bit outdated (used netstat instead of ss) and also covered only monitoring web services which are listening to a port. So I fiddle a bit around and found a solution to monitor systemd services.
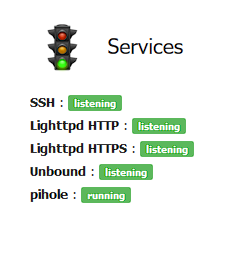
In the end there should be a section in the RPi web interface looking like this:

-
This guide assumes, that RPi-Monitor is already installed on a DietPi system.
-
Open a terminal on your machine, do
sudo nano /etc/rpimonitor/data.conf
to opendata.confand uncomment the below shown line (remove the # in front).This line contains the location of the upcomming config file we will create and use to monitor some services.
Save the file and get back to CLI with ctrl+o, enter / return, ctrl+x.
include=/etc/rpimonitor/template/services.conf
sudo nano /etc/rpimonitor/template/services.confto create the services config file. (Weirdly there are example / pre installed configs for every other case, but not for the services. At least at my installation)
Theservices.conf:
# collect data to show later on status page
dynamic.1.name=ssh
dynamic.1.source=ss -nlt
dynamic.1.regexp=LISTEN .+:(22).+
dynamic.1.default=0

# dynamic.2.name=rpimonitor
# dynamic.2.source=netstat -nlt
# dynamic.2.regexp=tcp .*:(8888).*LISTEN
# dynamic.2.default=0

dynamic.3.name=http
dynamic.3.source=ss -nlt
dynamic.3.regexp=LISTEN .+:(80).+
dynamic.3.default=0

dynamic.4.name=https
dynamic.4.source=ss -nlt
dynamic.4.regexp=LISTEN .+:(443).+
dynamic.4.default=0

dynamic.5.name=unbound
dynamic.5.source=ss -nlt
dynamic.5.regexp=LISTEN .+:(5335).+
dynamic.5.default=0

dynamic.6.name=pihole
dynamic.6.source=sudo systemctl show -p SubState --value pihole-FTL
dynamic.6.regexp=
dynamic.6.default=0

#config what will be shown on the status page
web.status.1.content.1.name=Services
web.status.1.content.1.icon=daemons.png
web.status.1.content.1.line.1="<b>SSH</b>: "+Label(data.ssh,"==22","listening","success")+Label(data.ssh,"!=22","not listening","danger")
web.status.1.content.1.line.2="<b>Lighttpd HTTP</b>: "+Label(data.http,"==80","listening","success")+Label(data.http,"!=80","not listening","danger")
web.status.1.content.1.line.3="<b>Lighttpd HTTPS</b>: "+Label(data.https,"==443","listening","success")+Label(data.https,"!=443","not listening","danger")
web.status.1.content.1.line.4="<b>Unbound</b>: "+Label(data.unbound,"==5335","listening","success")+Label(data.unbound,"!=5335","not listening","danger")
#web.status.1.content.1.line.5="<b>pihole</b> : "+Label(data.pihole,"==1","OK","success")+Label(data.pihole,"==0","KO","danger")
web.status.1.content.1.line.5="<b>pihole</b>: "+Label(data.pihole,"=='running'",data.pihole,"success")+Label(data.pihole,"=='dead'",data.pihole,"danger")+Label(data.pihole,"=='inactive'",data.pihole,"warning")
- Grab the content above and copy it into your
services.conf. Save this file (like we did with thedata.conf) and restart RPi-Monitor
sudo systemctl restart rpimonitor.
That’s it!
Now some explanation what this file does and how to customize is to your willings:
The first part of services.conf is to collect the data we want to check and show later on the status page (everything starting with dynamic.). I commented out the RPi-Monitor monitoring, it’s left from the other tutorial and it’s useless in my eyes ![]()
Basically it throws the command defined in dynamic.#.source= then filters it with the regexp and saves it. Later this data is just checked for its content and based on that we can dictate what will be shown on the status page.
As you can see, for the web services we are only checking if there is something listning on that port. (Filtering the output of ss -nlt by a desired port). With a extended bash command you can even check whatever you want (e.g. if it is the right service listening on that port or whatever).
I also wanted to check if my pihole instance is running. So after some trying and web searching I came up with sudo systemctl show -p SubState --value pihole-FTL which gives back a single line output like “running”, “inactive” or “dead” (or maybe even more, idk, I juste covered this 3 states). There are other ways to check this, my first attempt was to simply get an output like 0 and 1 for running and not running, but this is even a bit nicer.
You can simple replace the “pihole-FTL” to check any other service you want to.
The second part of the file defines what will be shown on the status page. The section is called “Services” and the icon next to it will be “daemons.png” which is the default one. Of course you can change this to you liking.
web.status.1.content.1.name=Services
web.status.1.content.1.icon=daemons.png
Then we create 5 lines like the one above, one for each service. Inside the content of these lines we analyze the data we grabbed earlier. I just show here the line for SSH:
web.status.1.content.1.line.1="<b>SSH</b>: "+Label(data.ssh,"==22","listening","success")+Label(data.ssh,"!=22","not listening","danger")
For SSH the content of data.ssh will look like:
LISTEN 0 1000 0.0.0.0:22 0.0.0.0:*
For the next step I’m not completly sure, because it was neither explained in the tutorial from where I copied it. But I think it then checks this string if there is a “22” inside (data.ssh,"==22"), if true it will be labeled “listening” and the “success” is basically the meta data for the color the label will have later.
“Success” is green, “danger” is red and I assume “warning” will be orange.
If it not match the 22 (data.ssh,"!=22","not listening","danger") it get’s labeled “not listening” and gets the color red. For other services we just change the number iof the port to check. In the dynamic and web.status sections.
web.status.1.content.1.line.5="<b>pihole</b>: "+Label(data.pihole,"=='running'",data.pihole,"success")+Label(data.pihole,"=='dead'",data.pihole,"danger")+Label(data.pihole,"=='inactive'",data.pihole,"warning")
For the pihole (or any systemd) service I simply check the state that was returned with
sudo systemctl show -p SubState --value pihole-FTL.
This data is saved in data.pihole. So it has only to check the output of this data for the color matching, because the label itself will be the output of data.pihole this time:
Label(data.pihole,"=='running'",data.pihole,"success")
Attention: I also had to put extra quotation marks around the strings we now want to check ("=='running'" "=='dead'" "=='inactive'").
So if you want to check any output of any command you earlier defined in the dynamic. section, make sure to use quotation marks when checking for strings. Basically the collected data of web services is also a string but the check can be done without qutation marks, which means it’s treated as int or something? This is beyond my knowledge, maybe somebody can tell me.