System Stats & Management
Overview
- DietPi-Dashboard - Official lightweight standalone DietPi web interface
- DietPi-CloudShell - Lightweight system stats for your LCD display or monitor
- GNU Midnight Commander - Console based visual file manager
- Linux Dash - Web interface system stats
- phpSysInfo - Web interface system stats
- RPi-Monitor - Web interface system stats
- Netdata - Web interface system stats
- Webmin - Remote system management with web interface
- Docker - Create, deploy, and run applications using containers
- Docker Compose - Define and run multi-container Docker applications
- Portainer - Lightweight management UI, managing your Docker host or Swarm cluster
- K3s - Lightweight Kubernetes
- MicroK8s - Low-ops, minimal production Kubernetes
- Prometheus Node Exporter - Prometheus exporter for hardware and OS metrics
- Prometheus - Monitoring system and time series database
- Homer - A modern homepage for your services
- Uptime Kuma - An easy-to-use self-hosted monitoring tool
How do I run DietPi-Software and install optimised software items?
To install any of the DietPi optimised software items listed below run from the command line:
dietpi-software
Choose Browse Software and select one or more items. Finally select Install.
DietPi will do all the necessary steps to install and start these software items.

To see all the DietPi configurations options, review the DietPi Tools section.
Return to the Optimised Software list
DietPi-Dashboard
DietPi-Dashboard is a very lightweight and standalone web interface for monitoring and managing your DietPi system with your favourite web browser. It is written in Rust. An overview of its features is given by our article: https://dietpi.com/blog/?p=1137

DietPi-Dashboard is accessible by default via HTTPS at TCP port 5252:
- URL:
https://<your.IP>:5252 - Password:
<your software password>(default:dietpi)
Using <hostname>.local instead of using <your.IP> (Avahi-Daemon)
By installing Avahi-Daemon, the web interface can be accessed with <hostname>.local (default: dietpi.local) instead of using <your.IP>. See the Avahi-Daemon documentation for details.
For communication between the web UI and the backend nodes, by default TCP port 5253 is additionally used.
The DietPi-Dashboard executable and its configuration files can be found at:
/opt/dietpi-dashboard
The configuration files for the frontend (web UI) and backend (system node) are located at:
/opt/dietpi-dashboard/config-frontend.toml
/opt/dietpi-dashboard/config-backend.toml
When doing changes, you need to restart the respective service afterwards:
systemctl restart dietpi-dashboard-frontend
systemctl restart dietpi-dashboard-backend
To change the password for the web UI, create a SHA512 hash of the PASSWORD you want to use for login. Apply it to the frontend configuration file and restart the service for the change to take effect:
hash=$(echo -n 'PASSWORD' | sha512sum | mawk '{print $1}')
GCI_PASSWORD=1 G_CONFIG_INJECT 'hash[[:blank:]]' "hash = \"$hash\"" /opt/dietpi-dashboard/config-frontend.toml
unset -v hash
G_CONFIG_INJECT 'enable_login[[:blank:]]' 'enable_login = true' /opt/dietpi-dashboard/config-frontend.toml
systemctl restart dietpi-dashboard
The new DietPi-Dashboard consists of two components, the frontend which provides the web interface, and the backend which enables communication with the system. One frontend can be used with multiple backend nodes, and when installing the dashboard with dietpi-software, it is possible to install the backend only, to use it with a frontend installed on another system already. The backend-only installation will ask for the needed info, but in case of non-interactive/automated installation, or if you want to change or setup this later:
- Check
/opt/dietpi-dashboard/config-frontend.tomlon the frontend host, or the “Config” page on its web UI. There is asecretsetting, and abackend_portsetting, which defaults to 5253. - Open
/opt/dietpi-dashboard/config-backend.tomlon the host of the backend node. Replacesecretto match the one from the frontend, andfrontend_addrwithIP:portof the frontend. Restart the backend service:
systemctl restart dietpi-dashboard-backend
DietPi-Dashboard by default is started as systemd services for frontend and backend, and can hence be controlled with the following commands:
systemctl status dietpi-dashboard-frontend
systemctl status dietpi-dashboard-backend
systemctl stop dietpi-dashboard-frontend
systemctl stop dietpi-dashboard-backend
systemctl start dietpi-dashboard-frontend
systemctl start dietpi-dashboard-backend
systemctl restart dietpi-dashboard-frontend
systemctl restart dietpi-dashboard-backend
Service logs can be reviewed with the following command:
journalctl -u dietpi-dashboard-frontend -u dietpi-dashboard-backend
You can easily update DietPi-Dashboard by reinstalling it and restarting the services for the change to take effect:
dietpi-software reinstall 200
systemctl restart dietpi-dashboard-frontend
systemctl restart dietpi-dashboard-backend
Source code: nonnorm/DietPi-Dashboard
License: GPLv3
DietPi-CloudShell
DietPi-CloudShell turns your console or LCD screen into a lightweight system stats display.
Sample screenshots
The following screenshots shall give an overview over the displaying features of DietPi-CloudShell.


YouTube video tutorial: DietPi CloudShell (RPi / Odroid XU4)
Configuration
Launch the DietPi-CloudShell control panel:
dietpi-cloudshell

DietPi-CloudShell offers scenes with predefined display outputs resp. layouts.
Scenes are configured in the Scenes dialog within dietpi-cloudshell.

This feature will allow you to automatically power down the screen and disable DietPi-CloudShell processing during a specific time.
Please note this feature requires DietPi-CloudShell to be launched with dietpi-autostart, or run dietpi-cloudshell from the main screen (tty1).
If you make changes to DietPi-CloudShell over SSH, once saved, please reboot the system to ensure this feature becomes activated.
Power saving: Auto screen off
Touchscreen support
See https://www.waveshare.com/3.2inch-rpi-lcd-b.htm.
This is available for all Raspberry Pi and Odroid versions. DietPi will automatically configure your system for the device.
Simply run dietpi-config, select Display Options, then select waveshare32.
After a reboot, your Waveshare32 will become active.

See https://www.hardkernel.com/shop/c1-3-2inch-tfttouchscreen-shield/.
This is available for all Odroid versions. DietPi will automatically configure your system for the device.
Simply run dietpi-config, select Display Options, then select odroid-lcd35.
After a reboot, your Odroid 3.5 LCD will become active.

The display feature of DietPi-CloudShell works generally with any LCD display or monitor with a resolution of at least 320x240 pixels.
GNU Midnight Commander
The GNU Midnight Commander (mc) is a visual file manager with a two column view. It allows to copy, move and delete files resp. whole directory trees as well as searching for files and run commands in a subshell. It also contains an internal viewer and editor.
Midnight Commander is a full-screen text mode application running on a regular console, inside an X Window terminal, over SSH connections and all kinds of remote shells.
Conflict with MinIO console client
The command mc is also used by the MinIO console client. If MinIO is installed on the same system, the mc shell alias is configured to call the MinIO console client instead. In that case, you can still run Midnight Commander with full path /usr/bin/mc, or setup an additional alias:
echo 'alias mnc=/usr/bin/mc' | sudo tee /etc/bashrc.d/midnight-commander.sh
source /etc/bashrc.d/midnight-commander.sh
mnc

Official website: https://midnight-commander.org/
Official documentation: https://midnight-commander.org/#documentation
Linux Dash
Linux Dash allows you to monitor your system stats from a web page.
- Also Installs: LASP webserver stack

The web interface of Linux Dash can be accessed via:
- URL =
http://<your.IP>/linuxdash/app
Using <hostname>.local instead of using <your.IP> (Avahi-Daemon)
By installing Avahi-Daemon, the web interface can be accessed with <hostname>.local (default: dietpi.local) instead of using <your.IP>. See the Avahi-Daemon documentation for details.
Official documentation: https://github.com/afaqurk/linux-dash/wiki
phpSysInfo
Allows you to monitor your system stats from a web page. The display output can be customized via an .ini file.
- Also Installs: LASP webserver stack

The web interface of phpSysInfo can be accessed via:
- URL =
http://<your.IP>/phpsysinfo
Using <hostname>.local instead of using <your.IP> (Avahi-Daemon)
By installing Avahi-Daemon, the web interface can be accessed with <hostname>.local (default: dietpi.local) instead of using <your.IP>. See the Avahi-Daemon documentation for details.
This is done via the file phpsysinfo.ini which is located in the phpSysInfo main directory (typical /var/www/phpsysinfo). An example file phpsysinfo.ini.new is present and gives inline information about all configuration options. Just walk through this file and discover all these bells an whistles.
Official website: https://phpsysinfo.github.io/phpsysinfo
RPi-Monitor
RPi-Monitor is a slick, lightweight system stats monitor with web interface.

The main features of RPi-Monitor are:
- Collecting, storing and presenting metrics
- It’s flexibly configurable
- It’s user extendable
- Metrics sharing can be done via JSON file or via SNMP
- Alert option
The web interface is accessible via port 8888:
- URL =
http://<your.IP>:8888
Using <hostname>.local instead of using <your.IP> (Avahi-Daemon)
By installing Avahi-Daemon, the web interface can be accessed with <hostname>.local (default: dietpi.local) instead of using <your.IP>. See the Avahi-Daemon documentation for details.
The configuration is described there: https://xavierberger.github.io/RPi-Monitor-docs/20_index.html
Official website: XavierBerger/RPi-Monitor.
Netdata
Netdata is a slick and feature-rich system stats monitor, with web interface.

The web interface is accessible via port 19999:
- URL =
http://<your.IP>:19999
Using <hostname>.local instead of using <your.IP> (Avahi-Daemon)
By installing Avahi-Daemon, the web interface can be accessed with <hostname>.local (default: dietpi.local) instead of using <your.IP>. See the Avahi-Daemon documentation for details.
Depending on your system, by default Netdata might be not accessible from remote browsers. If this is the case, open the configuration file/etc/netdata/netdata.conf
and change the linebind socket to IP = 127.0.0.1
to match either the local network IP or static public IP of your DietPi server depending on your needs. Alternatively comment it e.g. if your server does not have a static public IP but you require remote access. But note that an unprotected publicly accessible Netdata web interface is a potential security risk. Head over to the “Security hardening” tab to learn more about how to restrict access to Netdata.
Once saved, you will need to restart the service to implement the changes by entering the below into the terminal:
systemctl restart netdata
Note that having Netdata accessible to anyone gives potential attackers a bunch of useful information where to start hacking.
To learn about how to limit access to Netdata, please refer to their documentation regarding the configuration of access lists.
Official documentation: https://learn.netdata.cloud/docs/netdata-agent/
Wikipedia: https://wikipedia.org/wiki/Netdata
Webmin
Webmin is a web-based feature-rich remote system management tool. Many system settings can easily be set using the web interface dialogues.

The web interface is accessible via HTTPS on port 10000:
- URL:
https://<your.IP>:10000 - Username:
root(or any UNIX user with fullsudopermissions) - Password:
<this UNIX user's password>(default:dietpi)
Using <hostname>.local instead of using <your.IP> (Avahi-Daemon)
By installing Avahi-Daemon, the web interface can be accessed with <hostname>.local (default: dietpi.local) instead of using <your.IP>. See the Avahi-Daemon documentation for details.
Since Webmin runs as a systemd service, it can be controlled with the following commands:
systemctl status webmin
systemctl start webmin
systemctl stop webmin
systemctl restart webmin
Webmin service logs can be accessed with the following command:
journalctl -u webmin
Since Webmin is installed as APT package, it can be updated with the following commands:
apt update
apt install webmin
Official website: https://webmin.com/
Wikipedia: https://wikipedia.org/wiki/Webmin
Docker
In 2013, Docker introduced containers. These are a standardized unit of software that allows developers to isolate their application from the environment. Docker is de facto standard to build and share containerized apps - from single board computers (SBC), to desktop or cloud.
A Docker container image is a lightweight, standalone, executable package of software that includes everything needed to run an application: code, runtime, system tools, system libraries and settings.

Source: User:Maklaan - Based on a Docker blog post
The Docker configuration files are located at:
- Docker:
/etc/docker/daemon.json - containerd:
/etc/containerd/config.toml
Since Docker is installed via APT packages, it can be updated by running the following commands:
apt update
apt upgrade
Docker logs can be accessed using next command:
journalctl -u docker -u containerd
Docker offers plugins on its website (e.g. Docker Plugins amd64 stable), some of them are not installed by the Docker installation by default resp. are no install option from dietpi-software (like the Docker Compose plugin is one).
These additional plugins can be installed by the user as described below.
Docker Buildx CLI plugin:
apt install docker-buildx-plugin
Docker vulnerability scan CLI plugin:
apt install docker-scan-plugin
For running container rootless:
apt install docker-ce-rootless-extras
Docker downloads image file chunks to /mnt/dietpi_userdata/docker-data/tmp when generating a Docker image. After this, the file chunks are deleted as they are only temporary files.
In case of a slower disk (e.g. SD Card) this takes a longer time due to the SD Card reading/writing speed. To speedup the image generation, a tmpfs file system can be used.
A drawback of using a tmpfs is the required RAM, i.e. enough RAM memory (e.g. > 2 GB) should be present for the tmpfs.
The tmpfs file system can be added manually via the file /etc/fstab by entering a line (e.g. in the TMPFS area) like:
tmpfs /mnt/dietpi_userdata/docker-data/tmp tmpfs size=2G,noatime,lazytime,nodev,nosuid
The size= option should be adjusted to the systems RAM size: Only a part of the total RAM size should be used to avoid low memory issues.
After changing the file /etc/fstab the tmpfs needs to be activated. This can be done via a file system remount via
mount -o remount /mnt/dietpi_userdata/docker-data/tmp
or a system reboot.
Official documentation: https://docs.docker.com/get-started/overview/
Configuration docs: https://docs.docker.com/reference/cli/dockerd/#daemon-configuration-file
Logging docs: https://docs.docker.com/engine/logging/
Wikipedia: https://wikipedia.org/wiki/Docker_(software)
Source code: moby/moby
License: Apache-2.0
YouTube video tutorial: DietPi Docker Setup on Raspberry Pi 3 B Plus
Docker Compose
Docker Compose is a Docker tool used to define and run multi-container applications. With Compose, you use a YAML file to create and configure your application’s services from this configuration file.
docker compose is an excellent tool for development, testing, continuous integration (CI) workflows, and staging environments.
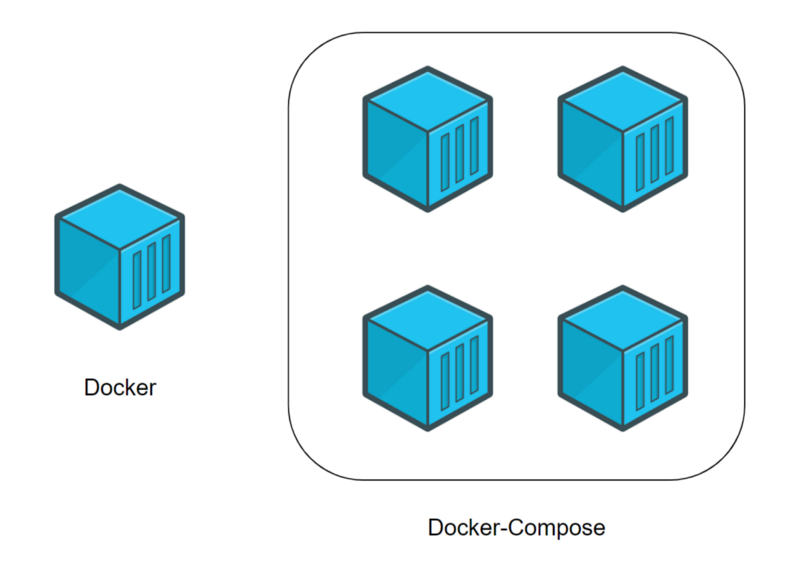
Docker (individual container) vs. Docker Compose (several containers) - source: A beginner’s guide to Docker
Since Docker Compose is installed via APT package, it can be updated by running the following commands:
apt update
apt upgrade
Official documentation: https://docs.docker.com/compose/
Getting started: https://docs.docker.com/compose/gettingstarted/
Sample apps with Compose: https://docs.docker.com/compose/samples-for-compose/
Release notes: https://github.com/docker/compose/releases
Source code: docker/compose
License: Apache-2.0
Portainer
Portainer simplifies your Docker container management via Portainer web interface. It enables faster deploy of the applications and it gives real time visibility.

The web interface is accessible via HTTPS on port 94421:
- URL =
https://<your.IP>:9442
Using <hostname>.local instead of using <your.IP> (Avahi-Daemon)
By installing Avahi-Daemon, the web interface can be accessed with <hostname>.local (default: dietpi.local) instead of using <your.IP>. See the Avahi-Daemon documentation for details.
To update Portainer, simply reinstall it:
dietpi-software reinstall 185
Official documentation: https://docs.portainer.io
Source code: portainer/portainer
Open-source license: zlib
K3s
Lightweight Kubernetes - The certified Kubernetes distribution built for IoT & Edge computing
![]()
The default installation of K3s creates a single-node cluster. If you want to have a multi-node setup, you need to configure the nodes to speak to the others.
In /boot/dietpi.txt, edit the SOFTWARE_K3S_EXEC parameter to set command (server or agent). You can add other command-line parameters after the command.
Example:
SOFTWARE_K3S_EXEC=server --disable=local-storage
If you need to add many command-line parameters, it is recommended to put them in a file instead, keeping only the command (server or agent) in /boot/dietpi.txt. During installation, if /boot/dietpi-k3s.yaml exists, it is copied to /etc/rancher/k3s/config.yaml, and used by K3s. The format of this file is documented in the K3s docs.
When running in server mode, K3s generates a kubeconfig file at /etc/rancher/k3s/k3s.yaml. Copy this to your client machine, and edit the server setting to point to the hostname of the server.
Place the file in the default location (~/.kube/config), or point to it using the KUBECONFIG environment-variable.
You should now be able to interact with your Kubernetes cluster using kubectl:
kubectl get nodes
kubectl get pods -A
- Service:
journalctl -u k3s
Official website: https://k3s.io
Official documentation: https://rancher.com/docs/k3s/latest/en/
Source code: k3s-io/k3s
License: Apache 2.0
MicroK8s
High availability - Low-ops, minimal production Kubernetes, for developers, cloud, clusters, workstations, Edge and IoT.

To create a cluster out of two or more already-running MicroK8s instances, use the microk8s add-node command:
microk8s add-node
From the node you wish to join to this cluster, run the following:
microk8s join 192.168.1.230:25000/92b2db237428470dc4fcfc4ebbd9dc81/2c0cb3284b05
Use the --worker flag to join a node as a worker not running the control plane, e.g.:
microk8s join 192.168.1.230:25000/92b2db237428470dc4fcfc4ebbd9dc81/2c0cb3284b05 --worker
For most commands, you can use microk8s in front like below.
microk8s kubectl get nodes
microk8s kubectl get namespaces
MicroK8s does provide a few “addons”, which can be seen below with the enable and disable command.
microk8s status # to view the addons
microk8s enable dns # to enable addons
microk8s enable dashboard # to enable Kubernetes dashboard
Per-node log files can be in:
/var/log/pods
Official website: https://canonical.com/microk8s
Official documentation: https://canonical.com/microk8s/docs
Addons documentation: https://canonical.com/microk8s/docs/addons
Source code: canonical/microk8s
License: Apache 2.0
Prometheus Node Exporter
Prometheus exporter for hardware and OS metrics. This component exposes system metrics, so they can be scraped by a dedicated Prometheus server, which can aggregate metrics from many devices. These metrics can then be visualized through Grafana, the final piece of a very powerful monitoring stack.

On Raspberry Pi SBCs, this software will include the Raspberry Pi Exporter, which will add RPi-specific metrics such as voltages, CPU frequencies and temperatures.
The metrics endpoint of Prometheus Node Exporter is exposed at TCP port 9100 and can be accessed via:
- URL =
http://<your.IP>:9100/metrics
Using <hostname>.local instead of using <your.IP> (Avahi-Daemon)
By installing Avahi-Daemon, the web interface can be accessed with <hostname>.local (default: dietpi.local) instead of using <your.IP>. See the Avahi-Daemon documentation for details.
A Prometheus server is required to scrape the metrics exposed by this exporter. It can be installed on this or another machine. DietPi provides Prometheus as a separate software title (ID 218), including a ready-to-use example configuration for this exporter.
Grafana not included
Note that this software component does not install or configure Grafana, it must be installed separately.
There are many pre-made templates of Grafana dashboards for visualizing data collected from a Prometheus Node Exporter. A good starting point is Node Exporter Full. You can import it directly into your Grafana instance by using ID 1860.
Since Prometheus Node Exporter runs as a systemd service, it can be controlled with the following commands:
systemctl status node_exporter
systemctl start node_exporter
systemctl stop node_exporter
systemctl restart node_exporter
Prometheus Node Exporter runs as a systemd service, hence logs can be viewed with the following command:
journalctl -u node_exporter
Prometheus Node Exporter can be updated by simply reinstalling it:
dietpi-software reinstall 99
Official website: prometheus/node_exporter
Official documentation: https://prometheus.io/docs/guides/node-exporter/
Prometheus RPi Exporter: fahlke/raspberrypi_exporter
License: Apache 2.0, MIT (for RPi Exporter)
Prometheus
Prometheus is an open-source monitoring system and time series database. It scrapes metrics from configured targets at given intervals, evaluates rule expressions, displays results, and can trigger alerts when specified conditions are observed. It is the natural companion to Prometheus Node Exporter and provides the server-side component of a monitoring stack that can be visualized through Grafana.

The Prometheus web interface is accessible via HTTP at TCP port 9090:
- URL:
http://<your.IP>:9090
Using <hostname>.local instead of using <your.IP> (Avahi-Daemon)
By installing Avahi-Daemon, the web interface can be accessed with <hostname>.local (default: dietpi.local) instead of using <your.IP>. See the Avahi-Daemon documentation for details.
- Binaries:
/opt/prometheus/ - Configuration file:
/mnt/dietpi_userdata/prometheus/prometheus.yml - Data directory:
/mnt/dietpi_userdata/prometheus/
The Prometheus configuration file is located at /mnt/dietpi_userdata/prometheus/prometheus.yml. It is created on first install and preserved on reinstall. A minimal example that scrapes a local Prometheus Node Exporter:
global:
  scrape_interval: 15s

scrape_configs:
- job_name: your.hostname
  static_configs:
  - targets: ['127.0.0.1:9100']
After editing the configuration file, restart the service to apply changes:
systemctl restart prometheus
Since Prometheus runs as a systemd service, it can be controlled with the following commands:
systemctl status prometheus
systemctl start prometheus
systemctl stop prometheus
systemctl restart prometheus
Prometheus runs as a systemd service, hence logs can be viewed with the following command:
journalctl -u prometheus
Prometheus can be updated by simply reinstalling it:
dietpi-software reinstall 218
Official website: https://prometheus.io/
Official documentation: https://prometheus.io/docs/
Source code: prometheus/prometheus
License: Apache 2.0
Homer
Homer is a modern and lightweight dashboard & homepage for your services

The Homer dashboard can be accessed via:
- URL:
http://<your.IP>/homer
Using <hostname>.local instead of using <your.IP> (Avahi-Daemon)
By installing Avahi-Daemon, the web interface can be accessed with <hostname>.local (default: dietpi.local) instead of using <your.IP>. See the Avahi-Daemon documentation for details.
You may bookmark this and save it as your browser’s home page, or alternatively look into tools like Nginx Proxy Manager and a DNS server such as AdGuard Home to give it a nice internal domain name such as homer.box.
To configure entries and icons for Homer, you can edit it’s config file /var/www/homer/assets/config.yml. Example contents:
services:
  - name: "Selfhosted"
    icon: "fas fa-cloud"
    items:
      - name: "Adguard Home"
        logo: "assets/icons2/adguard.png"
        subtitle: "A blackhole for the internet"
        tag: "Selfhosted"
        url: "https://adguard.box"
        target: "_blank"
      - name: "Nginx"
        logo: "assets/icons2/nginx.png"
        subtitle: "Reverse proxy - load balancer"
        tag: "Selfhosted"
        url: "https://nginx.box"
        target: "_blank"
      - name: "Shiori"
        logo: "assets/icons2/shiori.png"
        subtitle: "Web archiving + Read later"
        tag: "Selfhosted"
        url: "https://shiori.box"
        target: "_blank"
      - name: "Nextcloud"
        logo: "assets/icons2/nextcloud.png"
        subtitle: "A google suite alternative"
        tag: "Selfhosted"
        url: "https://nextcloud.box"
        target: "_blank"
In the example above, a column titled Selfhosted is being made which contains 4 entries. In the same directory as the config.yml, an icons2 folder exists, which contains icon images.
To update Homer simply re-run the installer by executing
dietpi-software reinstall 205
Remark: The dietpi-software script update procedure preserves the file config.yml automatically, there is no necessity for the user to do a restore manually.
If other files in /var/www/homer were previously changed by the user, they need to be copied in place (from the backup location /mnt/dietpi_userdata/homer_backup). As an example for a changed file manifest.json this could be done via:
cd /mnt/dietpi_userdata/homer_backup
mv manifest.json /var/www/homer/assets
You can customize Homer’s appearance by creating a theme, as described in the Homer documentation. Below are some community themes and examples of how to integrate them.

To apply the Catppuccin theme to Homer execute these steps:
Get theme:
apt install git
git clone https://github.com/mrpbennett/catppucin-homer
Choose one of the
cssfiles, they all have varying colour schemes, and copy it to Homer, for example thecatppuccin-macchiatostyle sheet:cp catppuccin-homer/flavours/catppuccin-macchiato.css /var/www/homer/assetsEdit the
config.ymlfile with:nano /var/www/homer/assets/config.ymlAdd the following lines (change
macchiatoto the wanted theme):# Will load catppuccin theme. stylesheet: - "assets/catppuccin-macchiato.css"
Source code: mrpbennett/catppucin-homer

To apply the DietPi theme to Homer execute these steps:
Get theme:
curl -fL 'https://codeberg.org/Cs137/homer-theme-dietpi/raw/branch/main/assets/dietpi-theme.css' -o /var/www/homer/assets/dietpi-theme.cssEdit your
config.ymlwith:nano /var/www/homer/assets/config.ymlAdd the following lines:
# Will load DietPi theme
stylesheet:
- "assets/dietpi-theme.css"
Source code: https://codeberg.org/Cs137/homer-theme-dietpi

To apply the Dracula theme to Homer execute these steps:
Get theme:
curl -fL 'https://raw.githubusercontent.com/dracula/homer/master/custom.css' -o /var/www/homer/assets/custom.css
curl -fL 'https://raw.githubusercontent.com/dracula/homer/master/dracula-background.png' -o /var/www/homer/assets/dracula-background.png
Edit your
config.ymlwith:nano /var/www/homer/assets/config.ymlAdd the following lines:
# Will load Dracula theme
stylesheet:
- "assets/custom.css"
Source code: dracula/homer

To apply the macOS styled theme to Homer execute these steps:
Get theme:
cd /tmp
curl -fLO 'https://github.com/walkxcode/homer-theme/archive/main.tar.gz'
tar xf main.tar.gz
rm main.tar.gz
cp homer-theme-main/assets/custom.css /var/www/homer/assets/custom.css
cp homer-theme-main/assets/wallpaper.jpeg /var/www/homer/assets/wallpaper.jpeg
cp homer-theme-main/assets/wallpaper-light.jpeg /var/www/homer/assets/wallpaper-light.jpeg
cp -R homer-theme-main/assets/fonts /var/www/homer/assets/
rm -R homer-theme-main
Edit your
config.ymlwith:nano /var/www/homer/assets/config.ymlAdd the following lines (make sure to remove content for colors, theme, and columns if they previously existed):
stylesheet:
- "assets/custom.css"

columns: "3" # You can change this to any number that is a factor of 12: (1, 2, 3, 4, 6, 12)
theme: default
colors:
light:
    highlight-primary: "#fff5f2"
    highlight-secondary: "#fff5f2"
    highlight-hover: "#bebebe"
    background: "#12152B"
    card-background: "rgba(255, 245, 242, 0.8)"
    text: "#ffffff"
    text-header: "#fafafa"
    text-title: "#000000"
    text-subtitle: "#111111"
    card-shadow: rgba(0, 0, 0, 0.5)
    link: "#3273dc"
    link-hover: "#2e4053"
    background-image: "../assets/wallpaper-light.jpeg" # Change wallpaper.jpeg to the name of your own custom wallpaper!
dark:
    highlight-primary: "#181C3A"
    highlight-secondary: "#181C3A"
    highlight-hover: "#1F2347"
    background: "#12152B"
    card-background: "rgba(24, 28, 58, 0.8)"
    text: "#eaeaea"
    text-header: "#7C71DD"
    text-title: "#fafafa"
    text-subtitle: "#8B8D9C"
    card-shadow: rgba(0, 0, 0, 0.5)
    link: "#c1c1c1"
    link-hover: "#fafafa"
    background-image: "../assets/wallpaper.jpeg"
Source code: walkxcode/homer-theme
Official website: bastienwirtz/homer
Official demo: https://homer-demo.netlify.app/
Uptime Kuma
Uptime Kuma is a fancy self-hosted monitoring tool.

The Uptime Kuma dashboard can be accessed via:
- URL:
http://<your.IP>:3002
Using <hostname>.local instead of using <your.IP> (Avahi-Daemon)
By installing Avahi-Daemon, the web interface can be accessed with <hostname>.local (default: dietpi.local) instead of using <your.IP>. See the Avahi-Daemon documentation for details.
The Uptime Kuma executable files can be found at:
/opt/uptime-kuma
The configuration of Uptime Kuma is done within the UI itself, no special configuration files are needed to be handled by the user. Uptime Kuma itself holds a database which is located at:
/mnt/dietpi_userdata/uptime-kuma
To update Uptime Kuma simply re-run the installer by executing
dietpi-software reinstall 176
Official website: louislam/uptime-kuma
Official documentation: https://github.com/louislam/uptime-kuma/wiki
Official demo: https://uptime.kuma.pet/
License: MIT
Additional information page: https://uptimekuma.org/
Return to the Optimised Software list
Lyrion Music Server listeners on port
9000already, hence Portainer is configured to use port9002. For more details on the Portainer implementation in DietPi see the GitHub task: MichaIng/DietPi!3933 ↩